Sometime back, you had brought out a point.
How do we add “Weightages” of Age/Exp./Edu. etc. to the Competence-Profile of a person?
I have not found a neat solution to this problem, until I see your point.
“We are not comparing Apple with Apple, when we compare Mr. Mhatre’s COMPETENCE SCORE with the same for entire population.”
The entire population whose Primary Function = Sales is 9563.
PRESTO!
The moment we click on button:
[Compare Apple-for-Apple]
We see altogether different COMPETENCE-SCORE FREQ. DISTRIBUTION GRAPHS, in which:
No more diluting his rating/ranking in a hotchpotch (kitchdi) of all-and-sundry professionals, whose only LCD (lowest common denominator) is that they are all, primarily, SALES professionals. But beyond this one/single attribute, they otherwise form a very HETEROGENEOUS GROUP!
Having captured all STRUCTURED data for/from every incoming resume, it is relatively simple/straightforward for the software to:
→ Create such Freq. Dist. Graphs for each & every “variable” (we can expect hundreds of combinations).
→ Once-a-day, update all such graphs (by updating all data-tables) based on resumes processed during the course of the day on our Webserver.
As we discussed, we can tell the potential subscribers:
“Sir/Madam,
If you process (thru Resumine), the email resumes of all of your EXISTING employees, then you can generate such COMPETENCE SCORE FREQ. DIST. GRAPHS for your own Company (of course, provided you employ a large enough no. of professionals in each category/functional area).
Thereafter, anytime you are trying to interview/recruit an outsider professional, you could super-impose his Competence Score on your Freq. Dist. Graph to figure out where exactly does this outsider stand (in comparison with your own internal population of similar/identical professionals).
You can make “Apple-for-Apple” comparison of an Outsider with your Insiders!”
This will help you in “structuring” an optimum “offer” for that candidate, in terms of:
→ Designation to be offered
→ Salary to be offered
WITHOUT upsetting your own Internal Apple-Cart!
This will also help you – as an enlightened HR Manager – to convince your own internal employees as to how no injustice has been done to them, when offering such designation/salary to an outsider.
Generation of such Internal Freq. Dist. Graphs (of existing employees) would also help you in:
→ Performance Appraisal
→ Annual Rewards
→ Training Need Assessment etc.
ONE IMPORTANT POINT
All Freq. Dist. Curves & Comparisons will be offered as a feature to only those subscribers who accept/agree to keep their resume-databases on our Webserver.
Those who wish to keep their resumes on their own local harddisks will NOT get this (free) service. Since (our argument) these graphs are generated ON-THE-FLY!
Kartavya
28/02/2003
COMPETENCE – PROFILING
When a Corporate wants to borrow money from a Bank/Fin. Insti. or wants to make a Public Issue, it has got to get a CREDIT RATING (AAA/AA/AB/DA) from {CRISIL / S&P / MOODYS / DUN & BRADSTREET} etc.
Even Countries are rated by such Agencies & these “Ratings” determine:
→ Country’s borrowing capacity
→ Foreign Investors’ confidence in repayment capability of that Country, etc. etc.
These “Ratings” are not static. Based on changing circumstances/events, such ratings are revised periodically.
In case of Countries, the Rating Agencies do not wait to receive any “request” from the concerned Country. The Agencies carry-out & publish their ratings/findings on their own & independently.
In case of Corporates, agencies carry out ratings
→ Independently on their own
→ As & when requested by a Corporate.
Thru our “COMPETENCE-PROFILING” in Resumine, could we, someday, hope to become such an INDEPENDENT / UN-BIASED / OBJECTIVE RATING AGENCY as far as jobseeker’s are concerned?
Could we foresee a day when Recruiters insist that each & every incoming email resume is accompanied by 3P COMPETENCY-PROFILE RATING-SHEET (see enclosed graphs), without which the application will NOT be considered?
ALTERNATIVELY
When an email resume is processed thru Resumine, competency profiles, as per enclosed graphs, gets automatically generated & presented to recruiter/interviewing expert, at the click of a mouse?
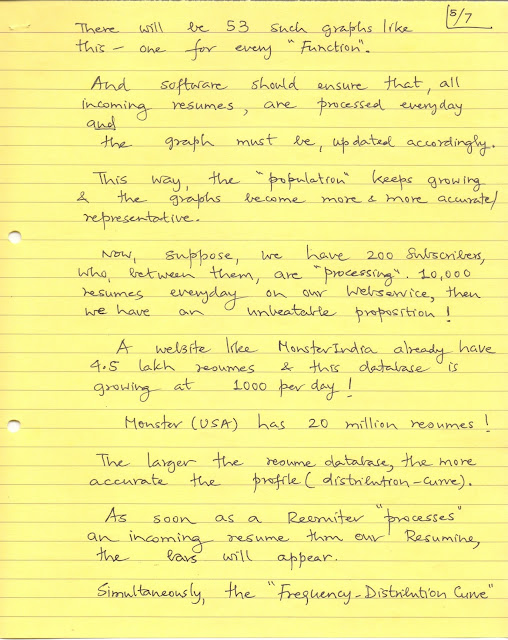
If thousands of resumes pour into our webservice everyday (from hundreds of subscribers), the “profiles” become more accurate. Also, there is “consistency/clarity/objectivity.” And everytime a jobseeker (using PEN which is owned by him) sends revised email resume, profile gets updated with a “date-stamp.”
Let us give the world – 3P RATING
These “ratings” exercises follow clearly-defined & transparent “Methodologies,” so that there is:
→ Consistency
→ Clarity
→ Objectivity (as far as possible – because there could be some “factors” which may not lend themselves for “Objective Measurements.”
eg: Govt. Policies, War Risk, Quality of Management etc.)
These “Consistency/Clarity/Objectivity” is what commands respect/belief amongst lenders/investors etc.
Same is true of “Online” Certifications issued by:
→ Microsoft (MCSE etc.)
→ Brainbench
There is “Consistency/Clarity/Objectivity” – since questions databank is created, “degree-of-difficulty” is assigned to each question and finally each individual who takes an online Test gets a UNIQUE/RANDOMLY GENERATED test-paper without any human intervention!
No “Subjectivity” at all. Everything automated & software-driven → hence very high CREDIBILITY.
COMPETENCE – PROFILE
Mr. A. J. Mhatre PEN: ______
Date: ______
Where does he stand among Professionals whose:
-
Primary Function = SALES
-
Population = 9563
-
Mhatre’s score: 45%
(Hand-drawn bell curve showing his position at 45% in the Sales population)
-
Secondary Function = SALES
-
Population = 12,395
-
Mhatre’s score: 65%
(Hand-drawn bell curve showing his position at 65% in the Sales secondary function population)
-
Tertiary Function = SALES
-
Population = 23,684
-
Mhatre’s score: 90%
COMPETENCE – PROFILE
Mr. A. J. Mhatre PEN: ______
Date: ______
Where does he stand among Professionals whose:
-
Primary Function = MKTG
(Remember! Mhatre’s Primary Function = SALES)
-
Population = 4296
-
Mhatre’s score: 48%
(Hand-drawn bell curve showing 48% in Marketing primary)
-
Secondary Function = MKTG
(This is also Mhatre’s Secondary Function)
-
Population = 9085
-
Mhatre’s score: 60%
(Hand-drawn bell curve showing 60% in Marketing secondary)
-
Tertiary Function = MKTG
-
Population = 13,468
-
Mhatre’s score: 78%
(Hand-drawn bell curve showing 78% in Marketing tertiary)


