HELP 1 (Date: 26/09/09)
While selecting your
"Function/skill" backgrounds, consider:
- In which "function/skill" are you an EXPERT?
(This is your PRIMARY function/skill)
- In which "function/skill" you think you
are "GOOD"? (This is your SECONDARY function/skill)
- Which "function/skill" can you handle "COMFORTABLY"?
(This is your TERTIARY function/skill)
Your resume should be carrying
keywords which are "relevant" to the function/skills selected. Your
function-skill graphs/percentile score will be based on the presence/absence of
such keywords in your TEXT resume which you upload. If you are not happy
with these graphs, you may want to:
- Edit your Text resume
- Select a different Primary/Secondary/Tertiary
function-skill
- Do both
Scan_0002.jpg
HELP 2
- Your "Highest/Latest" educational
qualification must be entered first (at the top) – Very Important.
- Then, select [Add Degree] and add the
previous/preceding qualifications, in reverse chronological order, going
backward till 10th standard (i.e. high school graduation).
- Although it is not mandatory to go backwards up to
10th standard, it is desirable to do so. If you do so, your Education
Profile Graph will look comprehensive.
Scan_0003.jpg
HELP 4
- During your Registration, you selected what you
considered to be your PRIMARY/SECONDARY/TERTIARY functions/skills.
- Corresponding to these selections, our software
developed your respective graphical profiles which you see in your
MASTER/DEFAULT resume.
- In each of these graphs, you get to see:
- Your Raw Score
- Your Percentile Score [Your "rank"
amongst co-professionals]
- But you could have, during your career, worked in
many different "Functional Areas" or acquired many different
"skills".
- Are you curious to know what kind of
"Scores" would your text resume generate for those other
functions/skills? NO problem! Simply select functions/skills and then
click on [Update Percentile Score].
- You may want to note down the scores generated on a
piece of paper, before moving onto the next function/skill.
- Obviously, you want to [SAVE] those graphs
where your "Percentile Score" is respectable!
Scan_0004.jpg
HELP 5
- During your career, you may have worked on many
projects. You may not want to "list" all of these here – which
is ok.
- But do list those projects:
- $\rightarrow$ Where you played an
"important/pivotal role" (eg: Team Leader / Project Manager
etc)
- $\rightarrow$ Which were of "long
duration"
- $\rightarrow$ Where you were deputed
"overseas"
- $\rightarrow$ Which were executed for
"prestigious clients"
- $\rightarrow$ When you supervised a "large
team"
- $\rightarrow$ Where you deployed
"cutting-edge" technologies
- $\rightarrow$ Which entailed a significant
"revenue" for your Company
- $\rightarrow$ Which are "recent"
- Your "Project Graph" is the first thing a
recruiter looks at – and then decides whether you are worth calling for an
interview or not!
Scan_0005.jpg
HELP 6
- If none of the listed currency is selected, then
the "local" currency in which job-advts are posted, will be
shown in "Salary Offered" column.
- However, if you wish, you may select any given
currency (say US Dollars). In such a case, "Salary Offered"
column will show salaries in US Dollars for all the shortlist jobs –
irrespective of the "Salary Currency" indicated by the job-advertisers.
- This feature is extremely useful – especially for
American Recruiters who wish to know what kind of salaries are being
offered by (say) Indian Employers to a JAVA professional with 3 years of
experience!
Scan_0006.jpg
HELP 7
- It is important that you provide an
accurate/up-to-date/comprehensive profile of your Company. This could
incorporate your:
- Products / Services / R&D Activities
- Joint ventures / Collaborators
- Plants / Factories / Regional-Branch Offices
- Financial Highlights
- Expansion / Diversification Projects
- Overseas locations
- Employee strength
- HR Policies
- Organisational Structure etc. etc.
- When you Post Job, the Company Profile submitted
here will get auto-filled in the "Post Job" form. Of course you
can edit it there.
- When any candidate applies against one of your
vacancies – and you call him for an interview – you want to know how
"deeply" he is interested in a career with your Company. Ask
him, if he has read your Company Profile. If he says "Yes",
probe his knowledge of your Company. If he says "No", do not
waste your time!
- Your Company Profile is your FREE publicity / Press
Release. Treat it professionally.
Scan_0007.jpg
HELP 8
- As soon as you select any FUNCTION/SKILL, this box
gets filled up with some relevant keywords.
- But, since not all keywords are
"relevant" to all vacancies/positions, you may select $\square$
those which you consider to be relevant to the vacancy you are
advertising. Of course, you can add (by typing) any other keyword.
- The keywords are arranged in the descending order
of their past selection by all recruiters (frequency of past usage).
- Our software will pick up/shortlist those resumes
which contain the keywords selected $\square$ by you – (of course, as many
as possible).
Scan_0008.jpg
HELP 9
- Obviously, you should select the
"Currency" in which you will pay the selected/appointed
candidate. That is what he will expect. Of course, you can negotiate.
- This feature is useful for Corporate Employers who
are advertising vacancies with posting locations in different countries.
Scan_0009.jpg
HELP 10
- This form provides separate "fields" for
specifying:
- Industry Background of the desired candidate
- Function of the desired candidate
- Edu. Qualifications/Specialization
- Min Experience
- Job Description
- As far as "Candidate Attributes" are
concerned, you may wish to write about:
- Attitudes (towards colleagues/subordinates etc)
- Leadership Qualities
- Team-Building capabilities
- Work-ethics
- Social Behaviour
- Political Acumen
- Negotiating skills
- Professional Integrity etc. etc.
Scan_0010.jpg
HELP 11
- If you do not select any specific currency, then
the "current salary" column in Resume Search Results will
indicate salary in Indian Rupees, by default, no matter in what
actual/local currency the candidates are getting paid.
- But then recruiters from outside India may want all
candidates' salaries displayed in Euro / British Pound / US Dollar. They
may select a currency of their choice (we plan to add more currencies in
time to come).
- This enables overseas recruiters to compare
salaries being paid across the world to similar/identical candidates. This
is a great advantage for foreign recruiters wanting to hire Indian talent.
Scan_0011.jpg
HELP 12
- The moment you select any Function/Skill, this box
gets filled up with relevant keywords.
- You may select $\square$ only those which are truly
relevant to the kind of candidates you are looking for.
- These would be keywords which you would expect to
find in the resumes of shortlisted candidates.
- The keywords in the box are arranged in the descending
order of past usage (i.e., frequency of usage) by other recruiters
conducting resume searches.
- Of course, you may add other keywords by typing.
Scan_0012.jpg
HELP 13
- For your convenience, we have broken up the
"Submit Resume" process into several small stages.
- Currently, there are 5 stages (6 stages for
IT Professionals, viz: Project Details).
- Registration is incomplete unless you fill in Stage
1.
- The rest of the stages may be filled in at your
convenience, over a period of time (after login every time).
- As each stage gets completed, a relevant graph gets
generated and added to your MASTER/DEFAULT profile.
- Why should you complete ALL stages at one go?
- If you do, your MASTER/DEFAULT resume will contain
7 graphs (8 graphs for IT Professionals).
- That would enable you to generate Factorial 7
($7!$) customizations:
$$7 \times 6 \times 5 \times 4
\times 3 \times 2 \times 1 = 5040 \text{ unique customizations!}$$
- For IT professionals, this results in 40,320
customizations.
- Only we enable you to project your UNIQUENESS—and
get noticed by the recruiters!
Scan_0013.jpg
HELP 14
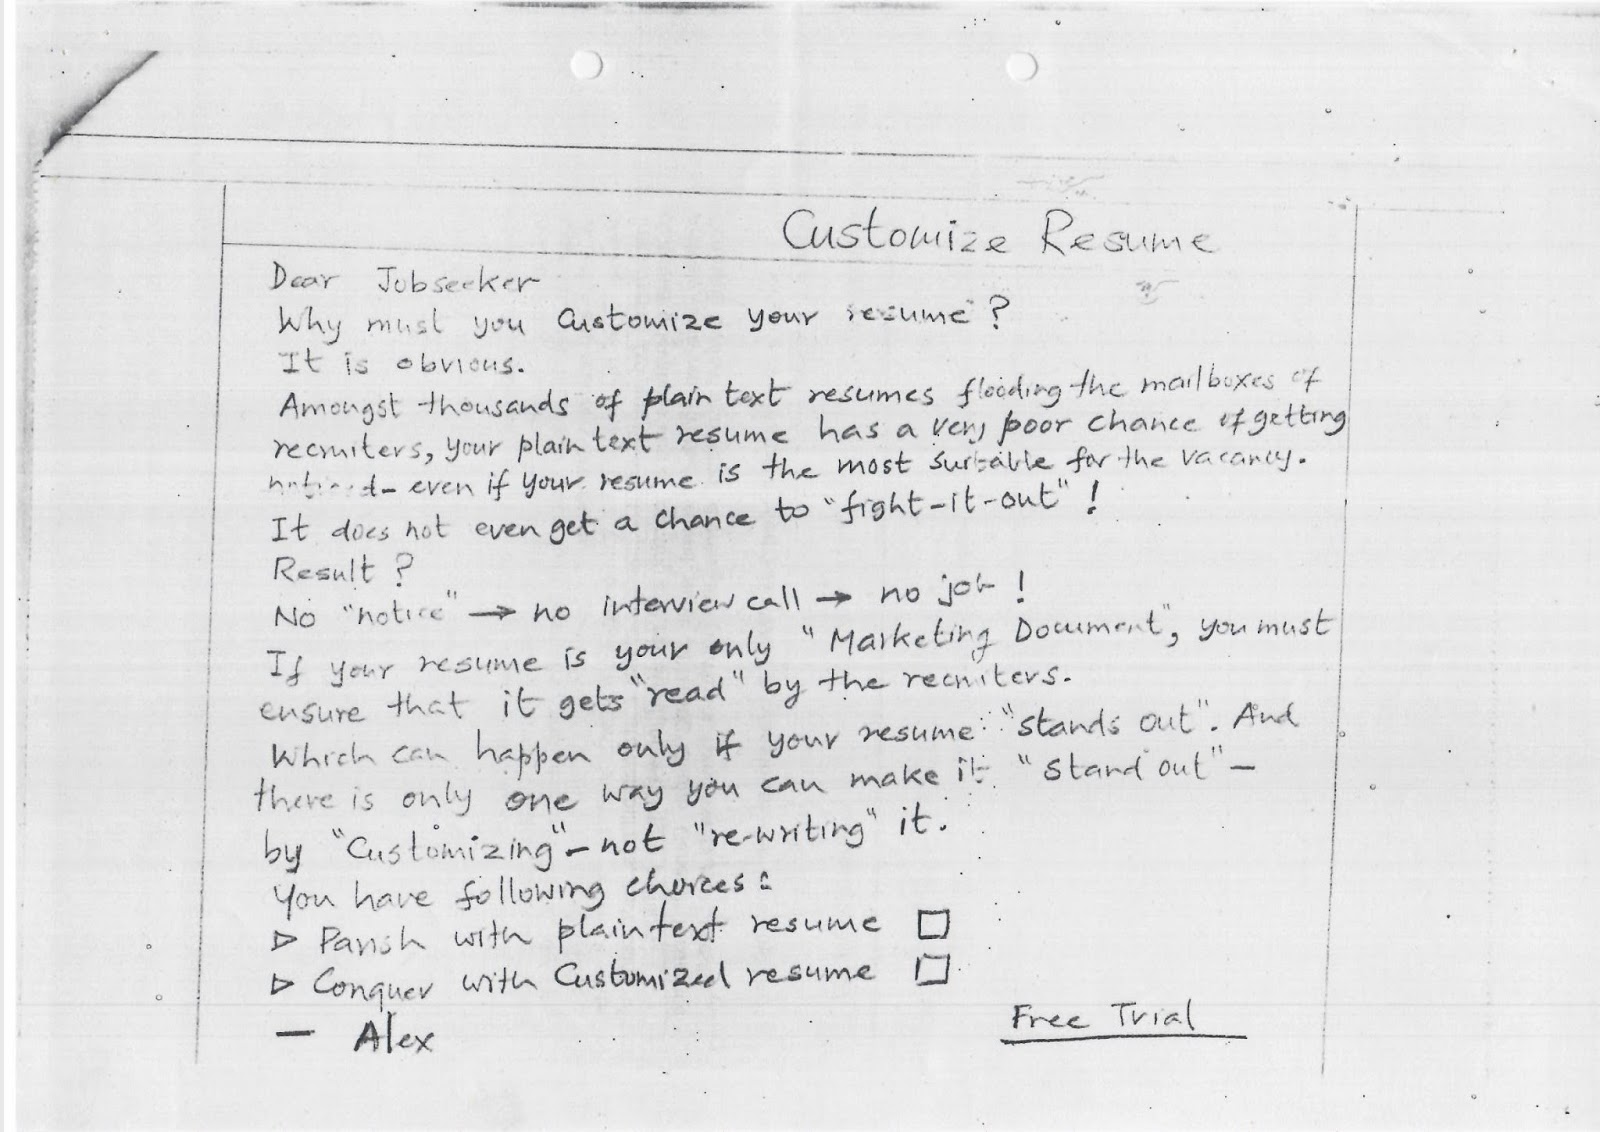
- Actually, this link will read "Why
Customize?" and it will be placed on the "Customize Your
Resume" page.
- I have already provided this write-up along with my
note at 06/09/09.
"FREE TRIAL" page
- I have already given "page write-ups"
along with my note at 06/09/09—but since then the "process" is
changed.
- Subsequently, I have given a new write-up to
Shalaka, which she has used.