
ImageBuilder
(Rahul
→ Saurabh → Pranav)
(21-04-06)
This
refers to our discussion this morning.
To
recapitulate:
- We
get only one chance to make a good first impression.
- This
impression should be so good that it sweeps the jobseekers off their feet.
- The
ImageBuilder must be something they have never seen before.
“There
never alighted on this orb,
a
vision more beautiful than that of
Mary
Antoinette.”
The
sheer magic of beautiful graphics should mesmerize the jobseekers — love
at first sight!
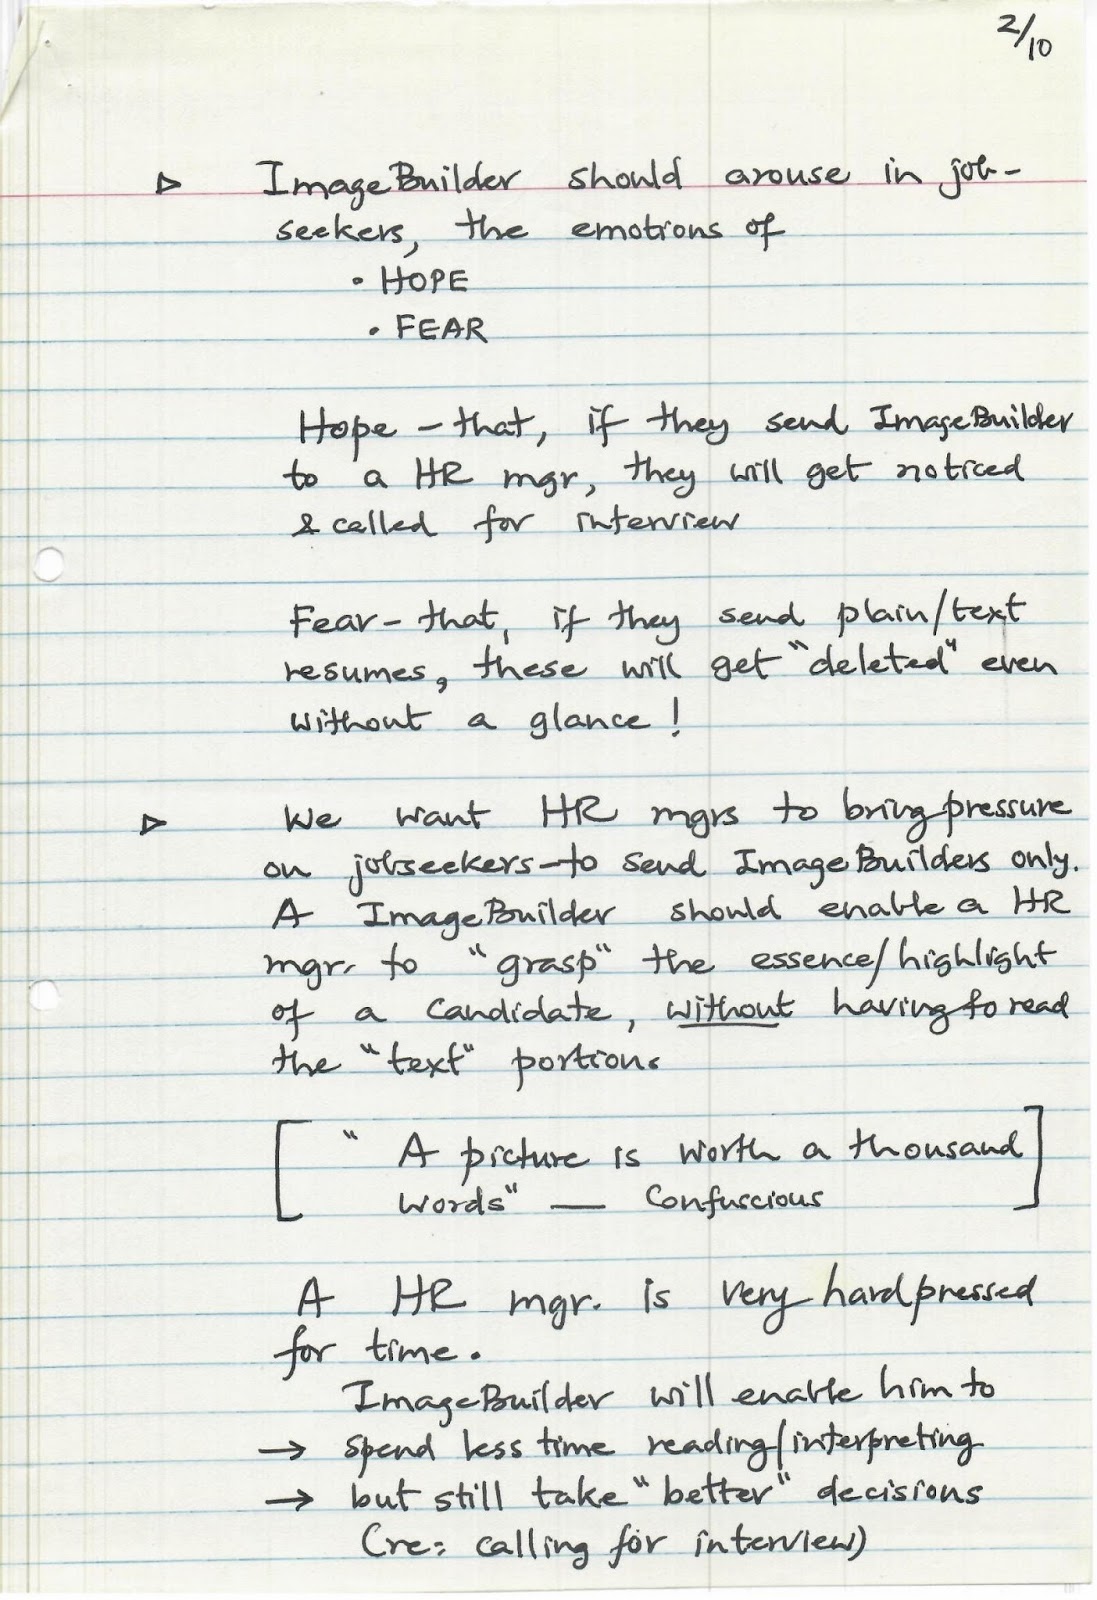
- ImageBuilder
should arouse in jobseekers the emotions of
- Hope
- Fear
Hope —
that, if they send ImageBuilder to an HR Manager, they will get noticed &
called for interview.
Fear —
that, if they send plain/text resumes, these will get deleted even
without a glance!
We
want HR Managers to bring pressure on jobseekers to send ImageBuilders
only.
An ImageBuilder should enable an HR Manager to grasp the essence/highlights
of a candidate without having to read the text portion.
“A
picture is worth a thousand words.” — Confucius
An
HR Manager is very hard-pressed for time.
ImageBuilder
will enable him
→
to spend less time reading/interpreting,
→
but still take better decisions (re: calling for interview).
ImageBuilder
(continued)
If
we succeed in getting HR managers of a few big companies to start insisting on
ImageBuilders, then this news will spread like wildfire — not only amongst the
jobseekers but even amongst HR managers of other companies!
ImageBuilder
should be good enough to start such a “FIRE”!
To
make it so “good,” from day ONE, it should display:
- Functional
Competence Profile
- Knowledge
Profile
- Tenure
Profile
- Salary
Profile
Now
you appreciate the significance of our logo:
^
|
/\
|
/ \
|______/____\_________>
More
profiles will follow.
Salary
Profile
In
my notes dated 17th & 18th, I had suggested that we introduce this profile after
a few hundred jobseekers actually register and provide a starting dataset
(of salaries) of a few hundred records.
I
had also suggested:
- “Functional”
population-wise graphs
- “Designation-level”
wise graphs
- (
— really a combination of both )
But
we have
→
29 Functions and
→
5 Designation Levels,
making
a total of 29 × 5 = 145 combinations.
We
will need to create these 145 data tables to store the “salaries,” which we
must still do.
ImageBuilder
(continued)
However,
as discussed this morning, we should not wait for “actual/real” data
(re: salaries) to accumulate before we can launch ImageBuilder.
Let
us simply create some fictitious data to start with — and then
“populate” the 145 data-tables with such fictitious data.
And
using this starting/fictitious data, even display the Salary Graph to
the very first person registering!
—
even superimposing his own “current salary” (vertical line “I am here”)
on the relevant graph.
For
sake of simplicity:
- We
will ignore “function” while displaying the graphs, although we
will display graphs according to the “Designation Level” clicked by
the jobseeker for his current job.
To
further simplify matters, we will generate & display salary graphs
for only the following Designation Levels to start with, viz.:
- Middle
Level
- Manager
Level
- Senior
Management Level
We
do not expect many jobseekers at the
- Entry
Level, and
- Top
Management Level
to
be registering on our site (at least in the beginning). Hence, we will not
generate these graphs in the beginning, even for those few who might
register.
But
we will capture their data.
And
when, in case of these two levels, we accumulate sufficient “real/actual”
data (from registrations), then we will generate/display their graphs.
LEVEL
Function
|------|------|------|
1
| ✓ |
| | Sales
2
| | ✓ |
| Mktg
3
| | | ✓
| R&D
...
| | |
|
29
| | ○
| |
Only
when (actual) data/records in each cell exceed 1000 (say)
will we start plotting graphs for that particular combination of Function ×
Level.
Till
such time, we will continue to club together all 29 functions and restrict
ourselves to only 3 design levels.
→
See enclosed tabulations/graphs for the 3 levels.
I
have assumed certain values (starting / fictitious values).
You
will further notice that I have assumed same/identical values for all 3
levels (— to simplify populating the data tables).
Of
course, identical values will generate identical graphs!
But
this is not a problem, because each visitor will only see one graph (the
one for his current designation level).
He
cannot view any other graphs — so there is no way he can compare!
Besides,
his focus/attention will be:
“Where
is the vertical line (of his current salary) placed in relation to the
profile?”
The
only person who can make such a comparison is an HR manager who receives
ImageBuilders of:
→ a Middle-level executive
→
a Manager, and
→
a Senior Management person.
He
may discover that all 3 profiles look (uncannily) identical!
ImageBuilder
(continued)
Even
in this case/instance, the X-axis on all three graphs are different —
also vertical lines are at different “salary intervals.”
But,
by the time an HR Manager gets to see 3 different level graphs at the same
time, I expect a few weeks would have passed — and by that time, the “Real
Values” would outnumber the “Fake Values” 10:1!
So,
by that time, all 3 (level) graphs would look very different, and therefore,
not comparable.
→
See “Salary Interval Overlap Situation” (enclosed).
In
real life, we can expect such an overlap.
But
once we have accumulated 10,000 salary values for each level (real
data), then we may discover that the real overlap is more or less as
compared to what I have provided in the beginning.
|
Salary
Interval |
% |
No.
of Instances |
|
5.01
– 6 |
5 |
50 |
|
6.0
– 7 |
15 |
150 |
|
7.01
– 8 |
22 |
220 |
|
8.01
– 9 |
30 |
300 |
|
9.01
– 10 |
12 |
120 |
|
10.01
– 11 |
8 |
80 |
|
11.01
– 12 |
4 |
40 |
|
12.01
– 13 |
2 |
20 |
|
13.01
– 14 |
2 |
20 |
|
14.01
– 15 |
– |
– |
|
15.01
– 16 |
– |
– |
|
Total |
100% |
— |
|
Salary
Interval |
% |
No.
of Instances |
|
9.01
– 10 |
5 |
50 |
|
10.01
– 11 |
15 |
150 |
|
11.01
– 12 |
22 |
220 |
|
12.01
– 13 |
30 |
300 |
|
13.01
– 14 |
12 |
120 |
|
14.01
– 15 |
8 |
80 |
|
15.01
– 16 |
4 |
40 |
|
16.01
– 17 |
2 |
20 |
|
17.01
– 18 |
2 |
20 |
|
18.01
– 19 |
– |
– |
|
19.01
– 20 |
– |
– |
|
Total |
100% |
1000 |
|
Salary
Interval |
Level |
|
0
– 1 |
|
|
1
– 2 |
|
|
2
– 3 |
|
|
3
– 4 |
|
|
4
– 5 |
|
|
5
– 6 |
Middle
↑ |
|
6
– 7 |
Middle
(Overlap) ↓ |
|
7
– 8 |
Manager
↑ |
|
8
– 9 |
Manager
(Overlap) ↓ |
|
9
– 10 |
Senior
↑ |
|
10
– 11 |
Senior
↓ |
|
11
– 20 |
— |
Salary
Profile – V 2.0
From:
Rahul cc: Saurabh → Pranav → Vikram → Rajeev Date: 18-04-06
This
is low priority.
This
is further to my yesterday’s note — The N-th Richest Man (Salary Profile V
1.0),
which,
of course, is high priority for launch immediately after the launch of India
Recruiter & Jobseeker site.
I
felt that while displaying a job-seeker’s Salary Profile graph (via
ImageBuilder), we need to add the following elements:
►
Race / Competition
Sports
races are perfect examples where each and every participant has one
single-minded goal, viz.:
To
overtake all others and come out first.
No
person without this instinct would ever enter this race.
Career-race
is no different. In the shortest possible time, every executive wants to
overtake his competitors (co-professionals), both in salary and in designation
(hierarchy).
While
depicting/drawing Salary Profile graphs, we must exploit this element — we must
bring it out in an explicit, vivid manner.
►
Stagnation / Frustration
This
is a very common feeling / sentiment among thousands of executives who feel
stagnated — stuck in the rut (groove).
They
feel their salaries are growing very slowly or that they are stuck at the same
level / position for a very long time.
Such a feeling / sentiment is at a subconscious level and rarely shared with
others in an open / diagnostic manner.
When
an executive sees his own Salary Profile in ImageBuilder, I want him to
ask (himself, of course):
“Where
am I? What am I doing here?
I
don’t seem to be going anywhere!
I
am stuck!
Rest
of the world (read ‘co-professionals’) are passing me by — moving ahead.”
How
can we generate these emotions in an executive when he sees his salary
profile?
See
attached illustration.
There
will be only one box for salary-profile (in ImageBuilder), as compared
with 3 boxes for Function Profile.
This
box will stretch across the entire width of ImageBuilder.
Inside
this box will be the Salary-Profile graph for his function — but with the
following animation:
First
to appear will be a graph for
“Mid-Level” (in
one colour).
After
a few seconds, it will disappear and get replaced by a graph for
“Manager
Level” (another colour).
After
staying visible for a few seconds, that too will disappear and get replaced by
a graph for
“Senior Management Level” (third colour).
Obviously,
all three graphs will be for executives belonging to the same function.
[I
have purposely avoided levels of → Top Management → Entry Level]
The
entire cycle will keep repeating.
This
sequential fading-in and fading-out of graphs in different colours will
give an impression of motion/movement — from left to right — a Forward
March.
So
it will resemble a “race” in which sub-populations of executives are
pressing / pushing forward (to the right) towards higher salaries.
It
is like relentless wave-following-wave.
One
can even add the figure of a surfer riding each wave — and trying to
stay ahead of each oncoming wave!
Then,
this way, we have achieved / captured the sentiment of RACE.
Now,
let us suppose our executive (Mr. A. J. Patel) is
→
at “Manager” level, and
→
drawing Rs. 7 L / year.
So,
at that salary-point on the X-axis, we show a vertical pole, on which a galloping
horse just keeps moving up & down the pole!
Stuck! No
horizontal movement.
I
am sure you have seen such wooden horses in small “merry-go-round”
devices on Juhu beach.
Small
children love this ride — they get a feeling of horse-riding / galloping.
But
no child is actually overtaking any other child — despite galloping!
Because
all children on all horses are moving forward at the same speed (keeping same
distance between them). The whole population is moving forward, but the
relative positions remain the same!
This
is fine with children — but not with grown-ups!
Could
there be any fun if, in a race, all players
→
are “spaced” in advance, and then
→
run at the same speed?
That
would be terribly boring!
Through
a horse riding a pole up-and-down, we want the executive to read
“I
am here”
as
“I
am stuck here!”
We
have succeeded in capturing the sentiment of stagnation / frustration.
We
have succeeded in getting Mr. Patel to identify himself with the horse!
Note:
- Graphs
should not fade away completely. When one is fully bright / sharp / dark,
others should be very light & slightly visible.
- Irrespective
of the “phase”, if the executive tries to DOWNLOAD / EMAIL, the
appropriate / relevant graph & the horse must get printed / shown in bright.
(Signed
– 18 Apr 06)
The
Nth Richest Man (page 1 of 3)
From:
Rahul cc: Saurabh → Pranav → Vikram → Rajeev Date: 17-04-06
What
beauty is to women, salary (wealth) is to men.
A
person is neither beautiful nor rich in absolute terms; it is always relative
to some other person or a group of persons.
But
mankind has an obsession with such relative comparisons.
It
is in human nature to compare oneself with others — especially with comparable
/ similar others (not just anybody).
This
obsession manifests itself in:
- Beauty
contests for women, e.g.
- Miss
India
- Miss
World
- Miss
Universe, etc.
This,
despite the fact that there are no objective / quantitative / scientific
measures (“units of measurement”) for beauty.
A
woman may appear “extraordinarily beautiful” to one man and just “ordinary”
to another!
As
they say,
“Beauty
is in the eyes of the beholder.”
Despite
such enormous subjectivity, millions allow themselves to get swayed by the
“announcements / proclamations” of a few well-known / eminent critics /
judges!
►
Rich Man / Wealthy Man Rankings for MEN
These
“rankings” are somewhat more objective — based on measurable criteria.
Of
course, there are no “contests” — at least visible contests!
But
you bet that Azim Premji, Narayan Murthy, Anil Ambani,
etc., are all anxiously scanning newspapers / magazines every morning to see if
Business Week or Financial Express etc. have just published their
(respective) lists of India’s Richest Men!
It
is quite likely that BW and FE may be using somewhat slightly
different criteria — but that difference is irrelevant.
What
is relevant is that both use objective / measurable and often even
transparent criteria. And what is more, they use the same criteria
consistently, year after year. So even if Azim Premji may disagree with Business
Week’s definition of “wealth,” he knows that
- The
same definition is applied to all others, and
- The
same definition will be used next year.
What
then matters is the relative rank.
Is
he moving up or down?
By
how much?
Who
is overtaking him? etc.
No
industrialist / businessman has ever challenged these rankings — even if he
believes the method is somewhat defective from his point of view!
Why?
All those being “ranked” trust the –
- objectivity
- fairness
- consistency
- transparency
of
the method.
And
it is precisely because of absolute “lack of bias” on the part of the
ranking organisation / institution / agency that the organisation has great
CREDIBILITY.
And
that organisation’s credibility goes up when it compares “like / similar
people”, all of whom have similar handicaps — e.g.:
→
Richest Men of India
→
of Asia etc.
Even
companies get ranked / rated (e.g. CRISIL ratings) and even countries get rated
/ ranked (e.g. S&P / Moody etc.).
What
has all of these to do with India Recruiter / Global Recruiter?
Quite
a lot.
GR/IR
must become such a rating / ranking agency when it comes to jobseekers.
We
are about to make a beginning in this direction by incorporating into our ImageBuilder
the module:
FUNCTION
PROFILES
(I
am tempted to call it “Functional Competence Profile”)
This
concept itself is very new / arguable / controversial.
On
top of that, our methodology (of assigning rank scores) is not transparent —
although it is quite objective.
Hence,
there is bound to be a lot of discomfort / reluctance on the part of both the
jobseekers and the HR managers to
The
Nth Richest Man (continued)
“ACCEPT”
our ratings/rankings — if only for the reason that they do not understand
how you are arriving at those scores/percentiles!
This
resistance (to acceptance) will be especially true amongst those jobseekers who
end up scoring low!
They will blame the method.
Of
course, we cannot help.
We
only hope that, since HR managers will find these ratings/rankings reasonably
reflecting their own assessment of the candidates, they will bring pressure on
the candidates to stop sending plain text resumes and send only the ImageBuilders.
Next,
we want to get onto Salary Ranking (really speaking, “Salary
Comparison”).
And,
in India Recruiter, we are capturing all the required data, viz.:
- Function
of each jobseeker (first priority)
- Design
level
- Annual
salary (current job) / experience block
With
these data, we need only 2–3 simple steps to draw a graph (as shown in Annex
B).
And
since the data has been supplied by the candidate himself, he cannot “discount”
it!
Again,
X–Y axes are easily understandable.
You
cannot find fault!
- In
Annex (A), tabulation at the top contains figures (numbers) representing
the number of registered executives belonging to that cell.
Now,
all cells will contain different numbers, which keep changing every minute, as
more and more jobseekers register.
I
feel, if any cell contains a number smaller than 100, we do not draw any
graph for that cell — we start plotting only when the number in any cell
exceeds 100.
Display
the “Population = 138” data.
Let
us start displaying this only when the number (in the cell) reaches a
respectable 1000.
At
this stage, you may wonder:
- In
“Function Competence Profile,” the X-axis is percentile,
- whereas
- In
“Salary Profile,” I am showing actual annual salary (class
intervals of 0–1 / 1.01–2 / 2.01–3 etc.) on the X-axis.
Why?
Because —
#1
→
Of
course, it is easy to understand an actual number (i.e., lakhs) as compared to
a conceptual number (i.e., percentile).
“Relative
standing” gets established much more easily in the mind of the jobseeker as
well as the HR manager.
#2
→
While
selecting / appointing a candidate, the HR manager has limitations /
constraints in the best / max salary that he can offer to any given
candidate (no matter how brilliant he is — say, with a percentile of 95%).
The
actual salary of the candidate, superimposed on the Salary Profile graph,
helps the HR manager to conclude the best salary that he should offer,
with full knowledge as to what is the “market value” of such a person —
—
what kind of salaries similar professionals are drawing, quite possibly even in
competing companies.
If,
by looking at this graph, the HR manager discovers that what he is prepared to
offer (by way of salary) is absolutely rock bottom by industry
standards, then he knows that he just cannot attract candidates — even those
with percentile of 30% — the duds!
Most
HR managers know that they have to offer 25%–35% more than what a
candidate is already getting in his current company before he will consider
making a change.
With
such a “Salary Profile” graph, an HR manager would be able to make a
rational / reasonable salary offer to a candidate, which —
- he
is convinced is fair by industry standard,
- he
believes will attract the candidate,
- he
knows will not upset his own existing, similar employees,
- he
can defend with his bosses, and
- will
not skew the industry norm or lead to unhealthy competition for talent
(especially scarce talent) amongst competing companies.
I
strongly feel that since Salary Profile will be greatly appreciated by
HR managers, for the first time instead of relying on hunch or feeling,
they will have statistical analytics to arrive at a rational decision.
This
graph will be such a powerful decision-making tool that I believe HR
managers will refuse to look at any other type of resume from any candidate!
They
will insist on ImageBuilder only!
We
can expect ImageBuilder to become a true industry standard only if and
when we can get all HR managers to bring pressure on jobseekers.
We
must make every HR manager our ImageBuilder’s Brand Ambassador — (of
course, for free!)
As
soon as we have launched India Recruiter (Jobseeker side), let us work
on this and implement it as fast as we can.
We
must do this even before we launch the Employer side.
And
Salary Profile has important implications / ramifications from a jobseeker’s
viewpoint as well.
Now,
for the first time, he knows what kind of salaries his co-professionals
Drawing!
“Theory of Relativity” kicks in!
Is
he ahead of the pack or trailing the pack?
Such
a “revelation” — that too, graphically plotted — could be exhilarating (if he
is leading the pack) or it could be devastatingly, mentally shattering, if he
is trailing almost all his co-professionals!
If
he knows he is underpaid, he is quite likely to show this “authentic”
graph to his boss / his personnel manager and ask for a raise — or
threaten to quit!
(Don’t
try this on me!)
Now,
what would happen if 6/8 (or 25% of employees) professionals go to their boss
flaunting this graph — and asking for raises?
Would
we have created a mini-revolt in an organisation?
Maybe.
Maybe
“Salary Profiles” may end up increasing the churn in industries — but it
will certainly bring in a lot of transparency.
And,
of one thing you can be rest assured —
Every
jobseeker who registers on India Recruiter will come back and edit
his resume once every year, immediately after the annual increments get
announced!
He
would want to make sure that:
- his
own ImageBuilder contains his new/revised salary, and
- he
is holding (or improving) his relative position amongst his
co-professionals (— because if he is falling behind / losing his rank,
then it is a cause for worry).
And
of course, every time he changes his job, he will come back and edit
because his salary would have gone up!
And
most certainly, he would encourage his colleagues (within his own company) to
register — so that they can compare their graphs!
We
may have found our HOLY GRAIL!
(Signed
– 17.04.06)


No comments:
Post a Comment