
Rahul
Mirror,
Mirror on the Wall
In
my yesterday’s note, at the bottom of this Webpage Write-up, I have added,
“Want
your current employees to rate you without registering? Send me an
email!”
Obviously,
no HR Manager would want his current employees to register on IndiaRecruiter
and lose them to competitors!
But
—
If there was a way/a method whereby his current employees can rate the
organization without registering, then quite a few HR Managers may want
to explore such a possibility.
In
such a method, we would have addressed his fear and still offered him
his organization’s
- PIP
/ rank-score
- relative
position (vis-à-vis other companies).
This/such
offer may prompt some HR Managers to come forward and ask for our proposal
before deciding.
Our
proposal (essence) would be as follows:
- On
a CD/from email, company will give us a database as follows:
|
Company
Name: |
|
|
Sr.
No. of Employee |
User
ID |
Based
on our instructions, company itself will generate User ID / Password for each
of its existing employees.
- We
will store these in our database (online) on IndiaRecruiter.
- Company
will now ask its employees to log into the “EVE calling” page of
IndiaRecruiter and login using their unique User ID / Password.
- Our
server will match these (in our online database) and honour/accept
the same (as valid), without insisting that the person be “registered,”
having submitted his resume (a special case).
Would
you like me to continue transcribing the remaining four pages (3/6 to 6/6)
next, and then assemble all six into a fully formatted Word document titled
“Mirror,
Mirror on the Wall — HR Employee Rating Proposal (11 April 2006)”?
As
soon as our server recognizes the User ID / Password, it will open up the Rating
Form, allowing the employee to fill in and submit.
Depending
upon our prior dialogue with the HR Manager, we may split/divide the Rating
Form into 3 parts, as follows:
RATING
FORM
|
Part
A |
Company
Name: __________________________ |
|
Employee
Status |
☐ Permanent ☐ Temporary |
|
Designation |
☐ Manager ☐ Supervisor ☐ Trainee |
|
Length
of Tenure |
☐ Less than 1 year ☐ 1 to 5 years ☐ 5+ years |
It
is quite possible that the company may want to analyze the feedback
received along the above-mentioned sub-populations (of employees) and even
compare different sub-populations.
(Hand-drawn
graph showing different curves for “Trainees,” “Supervisors,” and “Managers,”
each with different feedback distributions on an X–Y axis labeled “% of
Employees.”)
If
the company wants such Employee Feedback (Employee Attitude Survey) to
become an ongoing process, they could, over a period of time, even see
any shift taking place, e.g.
(Graph
showing June 2006 vs June 2007 curves for “Managers,” indicating a rightward
shift in satisfaction distribution.)
Such
shifts (towards left or towards right) would even tell them (the HR Managers):
1️⃣ Whether there is any improvement
or deterioration in the feedback from a given sub-population of
employees.
2️⃣ Whether management’s
actions to modify/alter certain policies/practices (based on initial
feedback) are leading to improvements (a shift to the right).
That
would be proof that management actions are yielding the desired results!
Would
you like me to continue with pages 5/6 and 6/6 next, and then
compile the full 6-page document into a polished Word version titled
“Mirror,
Mirror on the Wall — Employee Attitude Survey via IndiaRecruiter (11 April
2006)”?
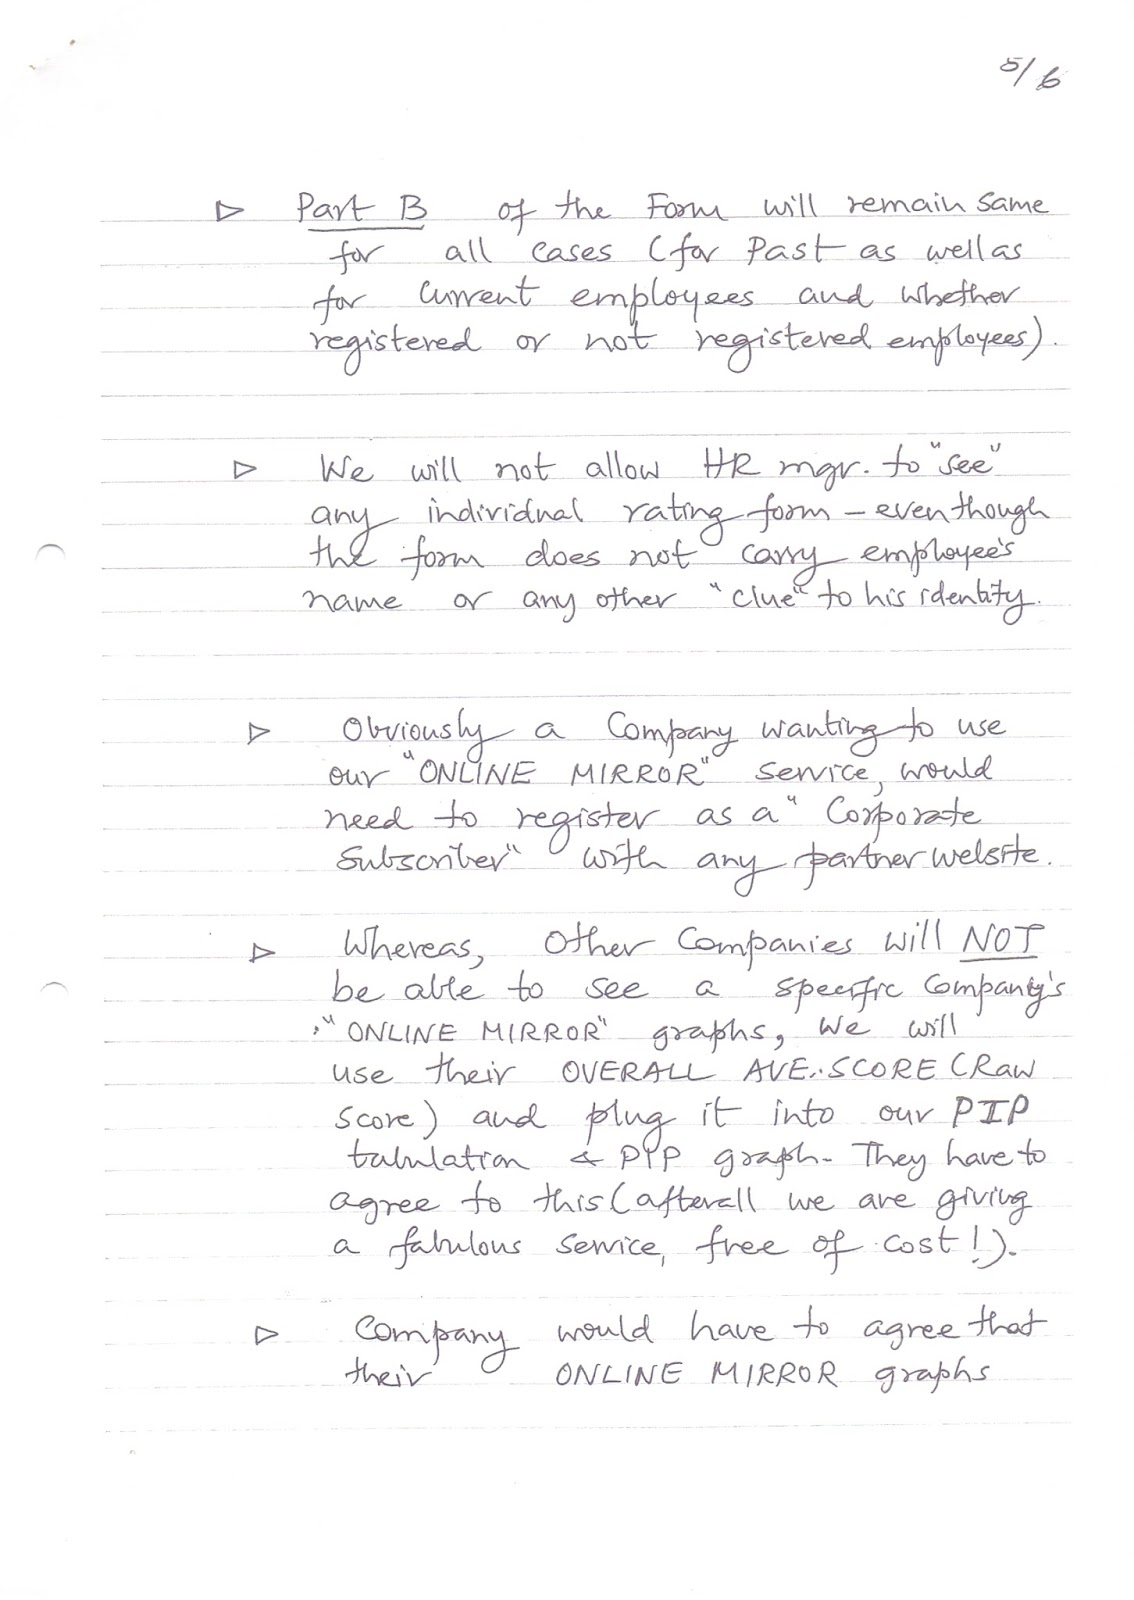
Part B of the form will remain the
same for all cases (for past as well as current employees — and whether registered
or not registered employees).
We will not allow the HR Manager to
see any individual rating form — even though the form does not carry the
employee’s name or any other clue to his identity.
Obviously, a company wanting to use our Online
Mirror service would need to register as a Corporate Subscriber (with any
partner website).
Whereas other companies will not be
able to see one specific company’s Online Mirror graphs, we will use their overall
average score (raw score) and plug it into our DTP formulation to plot
graphs.
They have to agree to this (after all, we are giving a fabulous service, free
of cost!).
Company would have to agree that their Online
Mirror graphs
…will
also become visible/viewable by any of their current employees:
•
to whom they have issued a User ID / Password, and
•
who has actually logged in and submitted his duly filled-in Rating Form first.
We
may agree that the individual employees are able to see/view only the
overall graph (for the entire employee population) and cannot see
sub-population-wise graphs.
What
is our advantage?
- Once,
through such free/fabulous offers, we succeed in bringing millions of current
employees to IndiaRecruiter, hopefully they will see Sample
ImageBuilder and get tempted to register!
Rahul
– Saurabh – Pranav
Examine
the words used to describe this technology:
- Snapshot
- Subset
- Vast
storehouse
- Optimized
- Content
density
- Captured
& compressed info
- Sample
- Millions
of answers
- Google
/ Yahoo
All
of the above apply to a specific “search query” — as in Google/Yahoo and the
search results.
Our
Function Profile Graphs too are such a “snapshot” or photograph.
(Hand-drawn
bell curve labeled “Function = Sales,” with total population 18,293 and
sub-population 265, showing percentiles from 30–90.)
Data/info
about 18,293 executives is “squeezed/condensed” into a small graph!
Hence, the graph has a very high Content Density.
And
someday, one of our Resume Search methods will involve:
- Displaying
the graph, based on an HR Manager’s “Search Parameters.”
- Enabling
the HR Manager to place his cursor on the 70th percentile — then dragging
to 90th percentile (thereby highlighting the graph’s area in between)
& clicking.
- This
will result in a short display tabulation containing one-line
summaries of only those executives whose percentile score lies between 70
& 90 — in descending order too!
Even
before clicking, the highlighted section has told him that he can expect to see
results for 265 executives meeting his criteria.
Any
area shaded or graphically indicated will show the number of executives covered
in that range.
12/04/06
Rajeev
cc: Vikram / Rahul / Saurabh / Pranav
A
CRAZY THOUGHT?
We
must not miss a single opportunity to impress / amaze jobseekers &
employers.
Let
us talk of Jobseekers.
Enclosed find a field-by-field comparison of “Submit Resume Forms” of Monster
& IndiaRecruiter — almost identical.
Now
if Rajeev’s Resume Download Spider starts downloading MonsterIndia
resumes from today afternoon, and simultaneously creates a structured resume
database (which, obviously, will be identical to IndiaRecruiter’s own
resume database), then—
We
can amaze the visiting jobseekers to our website as follows:
On
the Submit Resume form of IndiaRecruiter,
a jobseeker fills in:
- First
Name
- Last
Name
- DOB
- Gender
- City
Page
2/2
As
soon as he has entered these fields, our software will compare these values
with the values in resumes downloaded from MonsterIndia.
If
it finds a perfect match (all 5 values matching),
On
its own, our system will fill up automatically / instantaneously all the
remaining fields / values (including the full text resume), and display the
following message:
Dear
[Name],
We
believe we know who you are. We have filled in the rest of this form with data
about you, which we have in our database.
But
it is possible that some of it could be obsolete / outdated.
We
would appreciate if you would edit / update your data before clicking:
[EXTRACT
KNOWLEDGE OF PROFILES]
Believe
it or not?
Believe
it!
23/04/06
|
Field |
Monster |
IndiaRecruiter |
|
Name |
✓ (config. also) |
✓ (First / Last) |
|
Address |
✓ |
✓ |
|
Email |
✓ |
✓ |
|
Phone |
✓ |
✓ |
|
Nearest
City |
✓ |
✓ |
|
Current
Location |
✓ |
✓ |
|
DOB |
✓ |
✓ |
|
Gender |
✓ |
✓ |
|
Nationality |
✓ |
(Country) |
|
Field |
Monster |
IndiaRecruiter |
|
Work
Experience (Yrs) |
✓ |
✓ (location included) |
|
Skills |
✓ |
✓ (Glossary) |
|
Industry |
✓ |
✓ |
|
Category |
✓ |
✓ (Function?) |
|
Roles |
✓ |
✓ |
|
Current
Employer |
✓ |
✓ |
|
Annual
Salary (Rs. Lacs) |
✓ |
✓ |
|
Previous
Employer |
✓ |
✗ |
|
Highest
Qualification |
✓ |
✓ |
|
Highest
Degree Held |
✓ |
✓ |
|
Text
Resume |
✓ |
✓ |
Rahul
→ Saurabh → Pranav
Image Builder
This
refers to our discussion this morning.
To
recapitulate:
- We
get only one chance to make a good first impression.
- This
impression should be so good that it sweeps the jobseekers off their
feet.
- The
ImageBuilder must be something they have never seen before.
“There
never alighted on this orb a vision more beautiful than that of Mary
Antoinette.”
The
sheer magic of beautiful graphs should mesmerize the jobseekers — love
at first sight!
Would
you like me to combine this comparison sheet and the opening “ImageBuilder”
vision memo into a titled section:
“April 2006 – Resume Auto-Fill + ImageBuilder Launch Concept”,
and include a clean digital table format for the field comparison along with a
stylized opening page quoting your “love at first sight” line?
- ImageBuilder
should arouse in jobseekers the emotions of:
• Hope
• Fear
Hope
— that if they send ImageBuilder to an HR Manager, they will get noticed
& called for interview.
Fear — that if they send plain/text resumes, these will get deleted even
without a glance!
- We
want HR Managers to bring pressure on jobseekers to send ImageBuilders
only.
An ImageBuilder should enable the HR Manager to grasp the essence/highlights of a candidate without having to read the text portion.
“A
picture is worth a thousand words.” – Confucius
- An
HR Manager is very hard-pressed for time.
ImageBuilder will enable him to spend less time reading/interpreting — but still take better decisions (e.g., calling for interviews).
If
we succeed in getting HR Managers of a few big companies to start insisting on
ImageBuilders, then this news will spread like wildfire — not only amongst the
jobseekers but even amongst HR Managers of other companies!
ImageBuilder
should be good enough to start such a “FIRE”!
To
make it so good, from day one it should display:
- Functional
Competence Profile
- Knowledge
Profile
- Tenure
Profile
- Salary
Profile
Now
you appreciate the significance of our logo:
(Hand-drawn
bell curve labeled as the ImageBuilder logo illustration.)
More
profiles will follow.
→
Salary Profile
In
my notes of 17th & 18th, I had suggested that we introduce this profile after
a few hundred jobseekers actually register and provide a “starting data-set”
(of salaries of few hundred records).
I
had also suggested:
- “Functional”
population-wise graphs
- “Designation-level”
wise graphs
(– really a combination of both)
But
we have
→ 29 Functions
→ 5 Designation Levels
making
a total of
29 × 5 = 145 combinations
We
will need to create these 145 data-tables to store the “salaries” —
which we must still do.
However,
as discussed this morning, we should not wait for “actual / real data”
(re: salaries) to accumulate before we can launch ImageBuilder.
Let
us simply create some fictitious data to start with — and then
“populate” the 145 data-tables with such fictitious data.
And
using this starting / fictitious data, even display the SALARY GRAPH to
the very first person registering!
—
even superimposing his own current salary (vertical line “I am here”) on the
relevant graph.
For
sake of simplicity:
- We
will ignore “function” while displaying the graph, although we will
display graph according to the Designation Level clicked by the
jobseeker for his current job.
To
further simplify matters, we will generate & display salary graphs
for only the following designation levels to start with, viz.:
- Middle
Level
- Manager
Level
- Senior
Management Level
We
do not expect many jobseekers at the
- Entry
Level, and
- Top
Management Level
to
be registering on our site (at least in the beginning). Hence, we will not
generate these graphs in the beginning — even for those few who might
register.
But
we will capture their data.
And
when, in case of these 2 levels, we accumulate sufficient “real / actual” data
(from registrations), then we will generate/display their graphs.
Same
argument will hold for “Function-wise / Level-wise” graphs.
(Table
drawn)
|
Function |
Level |
|
Sales |
✓ |
|
Mktg |
○ |
|
R&D |
○ |
|
… |
… |
Only
when (actual) data records in each cell exceed 1,000 (?),
we will start plotting graphs for that particular combination of Function ×
Level.
Till
such time, we will continue to club together all 29 functions and restrict
ourselves to only 3 design levels.
See
enclosed tabulations / graphs for the 3 levels.
I have assumed certain values (starting / fictitious values).
You
will further notice that I have assumed same/identical values for all 3
levels (to simplify populating the data tables).
Of
course, identical values will generate identical graphs!
But this is not a problem, because each visitor will only see one graph
— his own (i.e., for his current design level).
He cannot see any other graphs — so there is no way he can compare!
Besides,
his focus/attention will be:
“Where
is the vertical line (of his current salary) placed in relation to the
profile?”
The
only person who can make such a comparison is an HR manager who receives
ImageBuilders of:
→ a Middle-level executive
→ a Manager
→ a Senior Manager
He
may discover that all 3 profiles look (uncannily) identical!
Even
in this case/instance, the X-axis on all 3 graphs are different — also vertical
lines are at different “salary-intervals.”
But,
by the time an HR manager gets to see 3 different level graphs at the same
time, I expect a few weeks would have passed — and by that time, the “Real
Values” would outnumber the “Fake Values” 10:1!
So
by that time, all 3 (level) graphs would look very different, and therefore,
not comparable!
→
See “Salary Interval Overlap Situation” (enclosed)
In
real life, we can expect such an overlap.
But
once we have accumulated 10,000 salary values for each “Level” (real
data), then we may discover that the real overlap is more or less as compared
to what I have provided in the beginning.
So,
you will need to keep your X-axis flexible / expandable.
For
Middle Level, it will be expandable only on the right side (i.e., salary
values exceeding Rs. 10–11 Lakhs). It cannot go below Rs. 0–1.0 L!
But
for the other two levels (i.e., Manager & Senior Management Level), the
actual values may
→ fall below the lowest point provided by me,
→ or go above the highest.
So
your data tables must have provisions for accepting such extreme values.
As
mentioned in my note (17th/18th), Salary Profile is our Holy Grail!
Neither jobseekers nor HR managers have even imagined such a graphical
comparison (of an individual vis-à-vis aggregated).
What
is more, Monster/Naukri/TimesJobs cannot offer this profile unless they
completely redesign their site/database — if at all they try to imitate.
If
they do, imitation is the best form of flattery!
But I doubt if their EGO will allow them to copy us!
|
Salary
Interval (Rs. Lakh) |
% |
No.
of Instances |
|
0
– 1 |
5 |
50 |
|
1.01
– 2 |
15 |
150 |
|
2.01
– 3 |
22 |
220 |
|
3.01
– 4 |
30 |
300 |
|
4.01
– 5 |
12 |
120 |
|
5.01
– 6 |
8 |
80 |
|
6.01
– 7 |
4 |
40 |
|
7.01
– 8 |
2 |
20 |
|
8.01
– 9 |
2 |
20 |
|
9.01
– 10 |
— |
— |
|
10.01
– 11 |
— |
— |
|
TOTAL |
100% |
1000 |
Level
= MANAGER
|
Salary
Interval (Rs. Lakh) |
% |
No.
of Instances |
|
5.01
– 6 |
5 |
50 |
|
6.01
– 7 |
15 |
150 |
|
7.01
– 8 |
22 |
220 |
|
8.01
– 9 |
30 |
300 |
|
9.01
– 10 |
12 |
120 |
|
10.01
– 11 |
8 |
80 |
|
11.01
– 12 |
4 |
40 |
|
12.01
– 13 |
2 |
20 |
|
13.01
– 14 |
2 |
20 |
|
14.01
– 15 |
— |
— |
|
15.01
– 16 |
— |
— |
|
TOTAL |
100% |
1000 |
Level
= SENIOR MANAGEMENT
|
Salary
Interval (Rs. Lakh) |
% |
No.
of Instances |
|
9.01
– 10 |
5 |
50 |
|
10.01
– 11 |
15 |
150 |
|
11.01
– 12 |
22 |
220 |
|
12.01
– 13 |
30 |
300 |
|
13.01
– 14 |
12 |
120 |
|
14.01
– 15 |
8 |
80 |
|
15.01
– 16 |
4 |
40 |
|
16.01
– 17 |
2 |
20 |
|
17.01
– 18 |
2 |
20 |
|
18.01
– 19 |
— |
— |
|
19.01
– 20 |
— |
— |
|
TOTAL |
100% |
1000 |
The
nᵗʰ Richest Man
(Dated
17 April 2006 — by Hemen Parekh)
To: Rahul
CC: Saurabh,
Pranav, Vikram, Rajeev
1.
What Beauty is to Women, Salary (Wealth) is to Men.
A
person is neither beautiful nor rich in absolute terms.
It
is always relative to some other person or group of persons.
But
mankind has an obsession with such relative comparisons.
It
is human nature to compare oneself with others — especially with comparable
or similar others (not just anybody).
2.
This Obsession Manifests Itself In:
→
Beauty Contests (for Women), e.g.:
- Miss
India
- Miss
World
- Miss
Universe
This,
despite the fact that there are no objective, quantitative, or
scientific measures (units of measurement) for “beauty.”
A
woman may appear extraordinarily beautiful to one man and
merely ordinary to another!
As
they say,
“Beauty
is in the eye of the beholder.”
Despite
such enormous subjectivity, millions allow themselves to get swayed
by the announcements or proclamations of a few well-known or eminent critics/judges.
3.
The Male Equivalent:
→
“Rich Man / Wealthy Man” Rankings (for Men)
These
“rankings” are somewhat more objective, being based on measurable
criteria.
Of
course, there are no “contests” — at least, not visible ones.
But
you bet that Azim Premji, Narayana Murthy, Anil Ambani, etc. are
all anxiously scanning newspapers or magazines every morning to see if Business
Week or Financial Express has just published their
(respective) lists of India’s Richest Men!
It
is quite likely that BW and FE may be using
somewhat slightly different criteria — but that difference is irrelevant.
What
is relevant is that both use objective / measurable and often even
transparent criteria. And what is more, they use the same
criteria consistently, year after year. So even if Azim Premji may
disagree with Business Week’s definition of “wealth,” he knows
that
- The
same definition is applied to all others, and
- The
same definition will be used next year.
What
then matters is the relative rank.
Is
he moving up or down?
By
how much?
Who
is overtaking him? etc.
No
industrialist / businessman has ever challenged these rankings — even if he
believes the method is somewhat defective from his point of view!
Why?
All those being “ranked” trust the –
- objectivity
- fairness
- consistency
- transparency
of
the method.
And
it is precisely because of absolute “lack of bias” on the part
of the ranking organisation / institution / agency that the organisation has
great
CREDIBILITY.
And
that organisation’s credibility goes up when it compares “like /
similar people”, all of whom have similar handicaps — e.g.:
→
Richest Men of India
→
of Asia etc.
Even
companies get ranked / rated (e.g. CRISIL ratings) and even countries get rated
/ ranked (e.g. S&P / Moody etc.).
What
has all of these to do with India Recruiter / Global Recruiter?
Quite
a lot.
GR/IR must
become such a rating / ranking agency when it comes to
jobseekers.
We
are about to make a beginning in this direction by incorporating into our ImageBuilder the
module:
FUNCTION
PROFILES
(I
am tempted to call it “Functional Competence Profile”)
This
concept itself is very new / arguable / controversial.
On
top of that, our methodology (of assigning rank scores) is not transparent —
although it is quite objective.
Hence,
there is bound to be a lot of discomfort / reluctance on the part of both the
jobseekers and the HR managers to
The
Nth Richest Man (continued)
“ACCEPT”
our ratings/rankings — if only for the reason that they do not
understand how you are arriving at those scores/percentiles!
This
resistance (to acceptance) will be especially true amongst those jobseekers who
end up scoring low!
They will blame the method.
Of
course, we cannot help.
We
only hope that, since HR managers will find these ratings/rankings reasonably
reflecting their own assessment of the candidates, they will bring pressure on
the candidates to stop sending plain text resumes and send only the ImageBuilders.
Next,
we want to get onto Salary Ranking (really speaking, “Salary
Comparison”).
And,
in India Recruiter, we are capturing all the required data, viz.:
- Function
of each jobseeker (first priority)
- Design
level
- Annual
salary (current job) / experience block
With
these data, we need only 2–3 simple steps to draw a graph (as shown in Annex
B).
And
since the data has been supplied by the candidate himself, he cannot “discount”
it!
Again,
X–Y axes are easily understandable.
You
cannot find fault!
- In
Annex (A), tabulation at the top contains figures (numbers) representing
the number of registered executives belonging to that
cell.
Now,
all cells will contain different numbers, which keep changing every minute, as
more and more jobseekers register.
I
feel, if any cell contains a number smaller than 100, we do not
draw any graph for that cell — we start plotting only when the number in any
cell exceeds 100.
Display
the “Population = 138” data.
Let
us start displaying this only when the number (in the cell) reaches a
respectable 1000.
At
this stage, you may wonder:
- In “Function
Competence Profile,” the X-axis is percentile,
- whereas
- In “Salary
Profile,” I am showing actual annual salary (class
intervals of 0–1 / 1.01–2 / 2.01–3 etc.) on the X-axis.
Why?
Because —
#1
→
Of
course, it is easy to understand an actual number (i.e., lakhs) as compared to
a conceptual number (i.e., percentile).
“Relative
standing” gets established much more easily in the mind of the jobseeker as
well as the HR manager.
#2
→
While
selecting / appointing a candidate, the HR manager has limitations /
constraints in the best / max salary that he can offer to any given
candidate (no matter how brilliant he is — say, with a percentile of 95%).
The
actual salary of the candidate, superimposed on the Salary Profile
graph, helps the HR manager to conclude the best salary that he
should offer, with full knowledge as to what is the “market value” of such
a person —
—
what kind of salaries similar professionals are drawing, quite possibly even in
competing companies.
If,
by looking at this graph, the HR manager discovers that what he is prepared to
offer (by way of salary) is absolutely rock bottom by industry
standards, then he knows that he just cannot attract candidates — even those
with percentile of 30% — the duds!
Most
HR managers know that they have to offer 25%–35% more than
what a candidate is already getting in his current company before he will
consider making a change.
With
such a “Salary Profile” graph, an HR manager would be able to make
a rational / reasonable salary offer to a candidate, which —
- he
is convinced is fair by industry standard,
- he
believes will attract the candidate,
- he
knows will not upset his own existing, similar employees,
- he
can defend with his bosses, and
- will
not skew the industry norm or lead to unhealthy competition for talent
(especially scarce talent) amongst competing companies.
I
strongly feel that since Salary Profile will be greatly
appreciated by HR managers, for the first time instead of relying on hunch
or feeling, they will have statistical analytics to arrive at a rational
decision.
This
graph will be such a powerful decision-making tool that I
believe HR managers will refuse to look at any other type of resume from any
candidate!
They
will insist on ImageBuilder only!
We
can expect ImageBuilder to become a true industry standard only
if and when we can get all HR managers to bring pressure on jobseekers.
We
must make every HR manager our ImageBuilder’s Brand Ambassador — (of
course, for free!)
As
soon as we have launched India Recruiter (Jobseeker side), let us
work on this and implement it as fast as we can.
We
must do this even before we launch the Employer side.
And Salary
Profile has important implications / ramifications from a jobseeker’s
viewpoint as well.
Now,
for the first time, he knows what kind of salaries his
co-professionals
Drawing!
“Theory of Relativity” kicks in!
Is
he ahead of the pack or trailing the pack?
Such
a “revelation” — that too, graphically plotted — could be exhilarating (if he
is leading the pack) or it could be devastatingly, mentally shattering, if he
is trailing almost all his co-professionals!
If
he knows he is underpaid, he is quite likely to show this “authentic” graph
to his boss / his personnel manager and ask for a raise — or
threaten to quit!
(Don’t
try this on me!)
Now,
what would happen if 6/8 (or 25% of employees) professionals go to their boss
flaunting this graph — and asking for raises?
Would
we have created a mini-revolt in an organisation?
Maybe.
Maybe
“Salary Profiles” may end up increasing the churn in industries — but it
will certainly bring in a lot of transparency.
And,
of one thing you can be rest assured —
Every
jobseeker who registers on India Recruiter will come back
and edit his resume once every year, immediately after the
annual increments get announced!
He
would want to make sure that:
- his
own ImageBuilder contains his new/revised salary, and
- he
is holding (or improving) his relative position amongst his
co-professionals (— because if he is falling behind / losing his rank,
then it is a cause for worry).
And
of course, every time he changes his job, he will come back and edit because
his salary would have gone up!
And
most certainly, he would encourage his colleagues (within his own company) to
register — so that they can compare their graphs!
We
may have found our HOLY GRAIL!
(Signed
– 17.04.06)


No comments:
Post a Comment