cc:
Kartavya / Abhi
Date:
03/10/03
Page: 4/6
|
Period |
5%
increase every 6 months |
10%
increase every 12 months |
|
0 |
100 |
100 |
|
6
month |
105 |
100 |
|
12 |
110.25 |
110 |
|
18 |
115.8 |
110 |
|
24 |
121.5 |
121 |
|
30 |
127.6 |
121 |
|
36 |
134.0 |
133 |
Sanjeev
– Webservice Pricing
- See
enclosed report on how cell-tariffs are once again inching up after
dropping for the last 3 years.
- In
context of our webservice, remember the following guidelines:
- Smaller
increases at more frequent intervals are more “digestible” than a big
increase every few years (or every year).
- You
should not increase prices of all transactions at the same time. We
should do this in rotation. So, if you have 12 “chargeable” buttons, you
raise the price of only one button each month. So, you end up
increasing prices of all buttons — once a year!
- All
price-increases (whenever made/announced) must not be of the same fixed
percentage.
One
button you may increase by 3% in January,
Second
button by 5% in February,
Third
button by 7% in March, and so on.
- In
between, in a particular month or quarter, you may not announce any price
increase for any button, but you may transfer some one button from FREE
to PAID category.
- Then,
in some month, you may be adding an altogether NEW button (new
functionality) which is PAID. In such a month, you must not
increase the price of any other button.
Many
organizations have failed to develop mechanisms whereby they can quickly and
easily differentiate between:
→
the increase/growth in the company’s annual revenue due to volume/quantity
increases, and
→ the increase/growth in the company’s annual revenue due to selling-price
increases.
This
is a dangerous/misleading situation!
Let
us say Recruitguru’s Net Collection goes up from Rs. 1 crore (in a particular
year) to Rs. 1.5 crore (in the next year).
That
is a growth of 50%!
But
is that a reason to be overjoyed?
This
increase could have been:
A
→
entirely due to increase in selling price only (i.e., no increase in
volume/quantity)
B
→
entirely due to increase in volume/quantity only (i.e., no increase in
selling price)
C
→
due to some increase in selling price and some increase in volume
(no. of transactions).
In
real business life, you rarely come across situations A or B.
Mostly it is C.
In
fact, the most likely situations are:
D
→
Increase in selling price / Decrease in volume, or
E
→
Increase in volume / Decrease in selling price.
So
a company’s performance must not be judged simply based on a “% age growth in
revenue over the previous year.”
It
is very, very important to know how this growth came about — what
factors contributed to this growth and how much was the contribution of each
factor.
This
Volume Variance / Price Variance analysis should be done not only at the
overall company level but also at the level of each and every subscriber as
well.
So,
whereas ARPU (Average Revenue Per User) and specific individual
revenue growth for each client are useful indicators, you must know at each
subscriber level:
→
Is his volume usage growing & contributing to increased billing? — and how
much?
Increase
in selling prices are like inflation (consumer price index).
A
business can simply increase its product/service prices by 15% each year and
show a revenue growth of 15% each year without selling even one piece more than
the previous year!
Shareholders
and the bankers and the employees all will be “happy” to see the...
...results,
and the share price will keep rising —
until
someday the company is unable to raise its prices due to increased
competition!
That will be the year of reckoning! The bubble will burst!
So,
for a healthy and sustainable growth, both the volumes and the prices
must rise to contribute to overall growth.
And
we must be able to monitor separately the effect/impact of both the volume-induced
revenue growth and the price-increase-induced revenue growth, year
after year.
For
Recruitguru, we will use the first FULL YEAR (viz., April 2004 –
March 2005) as our datum — the Base Year — and compute for each
subsequent year as follows:
|
Parameter |
Base
Year 2004–2005 |
2005–2006 |
2006–2007 |
|
Gross
Net Collection (or BL₹) |
e.g.,
Rs. 150L |
200L |
300L |
|
Index
(Gross) |
100 |
133 |
200 |
|
No.
of Transactions |
5
Lakh |
6
Lakh |
8
Lakh |
|
Index |
100 |
120 |
160 |
Sanjeev
Date:
20/09/03
Auto-roaming:
Cell Cos May Not Comply With TRAI Directive
(News
clipping dated 19/09/03 – Mumbai)
Cellular
operators seem set to flout the Telecom Regulatory Authority of India’s
directive to discontinue national roaming charges for incoming calls. The TRAI
had ordered all mobile operators to stop charging subscribers for incoming
calls while on roaming from September 19. Operators have reportedly continued
billing citing technical and revenue constraints, leading to consumer protests.
[Further clipping text truncated in image.]
Notes
- This
is an ingenious way of making money!
- Earlier,
Airtel had started diverting unanswered calls to your Voicemail Box
and treating all such calls as “Completed Calls” — charging the calling
party!
- “Automated
Roaming” started free — now made paid! (And if you have purchased a
pre-paid SIM card, you don’t have any option!)
Lessons
for Recruitguru
- These
happenings have valuable lessons for Recruitguru, which is both pre-paid
and pay-per-use.
- All
buttons which initially we propose to offer FREE,
- must
be listed on the Tariff Chart with the footnote:
“Currently
Free” — implying that we reserve our right to make these PAID/PRICED at
a future date.
- As
no. of clients and no. of transactions grow, one-by-one, gradually
(without giving shocks), we must convert these buttons to PAID.
(Signed/dated:
20-09-03)
Sanjeev
Date:
19/09/03
Subject: Pricing
– “Pay-per-Use” (USP)
R&G
Satchet Spurs Washing Powder Price War
(Economic
Times clipping dated 18/09/03)
Procter
& Gamble has triggered a fresh price war in the detergents market by
cutting the price of its Ariel and Tide sachets. Hindustan Lever is expected to
respond shortly. Analysts attribute this to shifting consumer preferences
towards smaller, affordable sachets offering pay-per-use convenience. [Further
clipping text truncated in image.]
Key
Insights
- Whether
it is Pan Parag or washing powder, whether it is Procter & Gamble or
HLL — marketing guys are fast learning one thing:
- →
Every consumer does not have the same amount of consumption.
- →
Every consumer wants to pay for only what he immediately consumes — not
for what he might consume tomorrow/3 weeks later/3 months later.
Examples
- Mobile
operators → Prepaid → Pay-per-use
- Cable
TV operators → Postpaid → Pay-per-use (CAS)
- Music
downloads → Prepaid → Pay-per-download (iTunes)
- Xerox
Me → Postpaid → Per copy xeroxed
- Plain
phones → Postpaid → Per call used
You
would do well to compile an exhaustive list of “pay-per-use” services and make
a PowerPoint slide for your presentation.
cc:
Kartavya / Abhi
HLL
Launches Lifebuoy at ₹2
(News
clipping — 19/09/03, by Namrata Singh)
Hindustan
Lever has launched Lifebuoy in a new ₹2 pack aimed at expanding its
presence in India’s vast rural market.
The
100-year-old brand, with sales of ₹350 crore and 31.8% growth rate, will now be
available in a smaller, more affordable sachet-like size of 18 grams,
priced at ₹2.
This
move targets deeper market penetration among lower-income groups and rural
consumers, providing a “feel-good” factor to the economy.
Sanjeev
Date:
20/09/03
Subject: Pricing
Strategy / Lessons to be learned (Lifebuoy)
- 100-year-old
brand / ₹350 crore sales / 31.8% growth rate.
- Repositioning
for better penetration in rural markets. (Here too, we
are talking of 30,000 cr in SME sector!)
- ₹2
for 18 grams, BUT strip of 12 packs.
- Pay-Per-Use
logic: Why must you buy 75g soap at ₹15/18 or
125g soap at ₹30/40 — especially if you need to use only 3g a day?
- This
is the reason (Pay-Per-Use logic) why sachets form 70% of total
shampoo market.
- With
each passing day, we see around us glorious examples of “Pay-Per-Use /
Penetration Pricing / Mass Market.”
(Dated:
20/09/03)
Kartavya
/ Abhi / Sanjeev
SriRam
/ Rajiv / Nirmit
Date:
16/09/03
Subject: Web-Service
Pricing
Page: 1/6
In
our meeting two days ago, I pointed out important guidelines regarding pricing
of our Recruitguru Webservice, viz.:
INDUSTRY
STANDARD
- Our
pricing strategy must enable us to become the de facto industry
standard.
This means any competitor who cares to venture into the area of Recruitment Webservices would need to follow the practice set by us. - This
is because the market expects the followers to offer a pricing structure
which can be easily compared with the structure already established by the
leader/pioneer.
- If
the next provider of recruitment self-servicing wants to charge per
hour/per month etc., he would face stiff resistance from corporates who
have already got used to Recruitguru’s per-click structure.
In
essence, we as pioneers must set and establish the “Rules of the Game,”
by which this entire new industry must play the game!
DYNAMIC
Our
pricing structure must be dynamic.
We
should be in a position to change it over a period of time — and as frequently
as deemed necessary.
We
should be able to make this change online (through ADMIN) so that
automatic email announcements go out to:
- Existing
clients
- Potential
clients
Whereas
for potential clients, the new structure becomes applicable (through revised
Tariff Chart) instantly, for existing clients it will become applicable when
their current Credit Balance becomes NIL / ZERO.
They
(the existing clients) must not be in a position to “cheat” us by depositing
another cheque for Rs. 5 lakhs the moment they hear that the per-mouse-click
prices are going up!
If
the new prices announced are reductions (i.e., going down), I have some
solution, but Sanjeev must come out with his proposals.
LOCK-IN
One
— perhaps the most important — feature of any pricing structure is to “Lock-in”
the customer and then make him pay for the rest of his life!
This
is why drug peddlers offer free dings in the beginning — once you get
addicted, the extortion process sets in!
This
is exactly what Reliance has done by offering a mobile handset for mere
₹501/– and then making you pay ₹220/– p.m. for 36 months!
If
you want to quit in between, you need to “refund” ₹8,000 / ₹5,000 / ₹3,000 (1st
/ 2nd / 3rd year)!
Of
course, a far subtler and unseen way of locking a customer is the non-portability
of your mobile no.!
If you have given this no. to hundreds of friends/relatives—and worse, to your
customers—you are hooked forever!
The
cost of switching—over to another service provider—no matter how cheap or how
excellent—will be mind-boggling.
This
is why we should price our “Extraction / Conversion” button at no more
than ₹5.00 (or even ₹2.50), so that having converted 1 lakh / 5 lakh resumes,
the customer has no choice but to remain locked-in!
MASS
CUSTOMIZATION
Our
pricing structure must enable us to “customize price for each and every
(paid) mouse-click for any given customer.”
So,
if there are 2,000 customers, theoretically, we can have 2,000 different prices
for (say) Extract Button 1.
So,
if we have 5 paid (not free) buttons, we would have 2,000 × 5 = 10,000
prices!
We
(Sanjeev) must use this fantastic mass-customization feature to extract
maximum money out of each customer — all the while giving the customer a
feeling of being uniquely / specially treated.
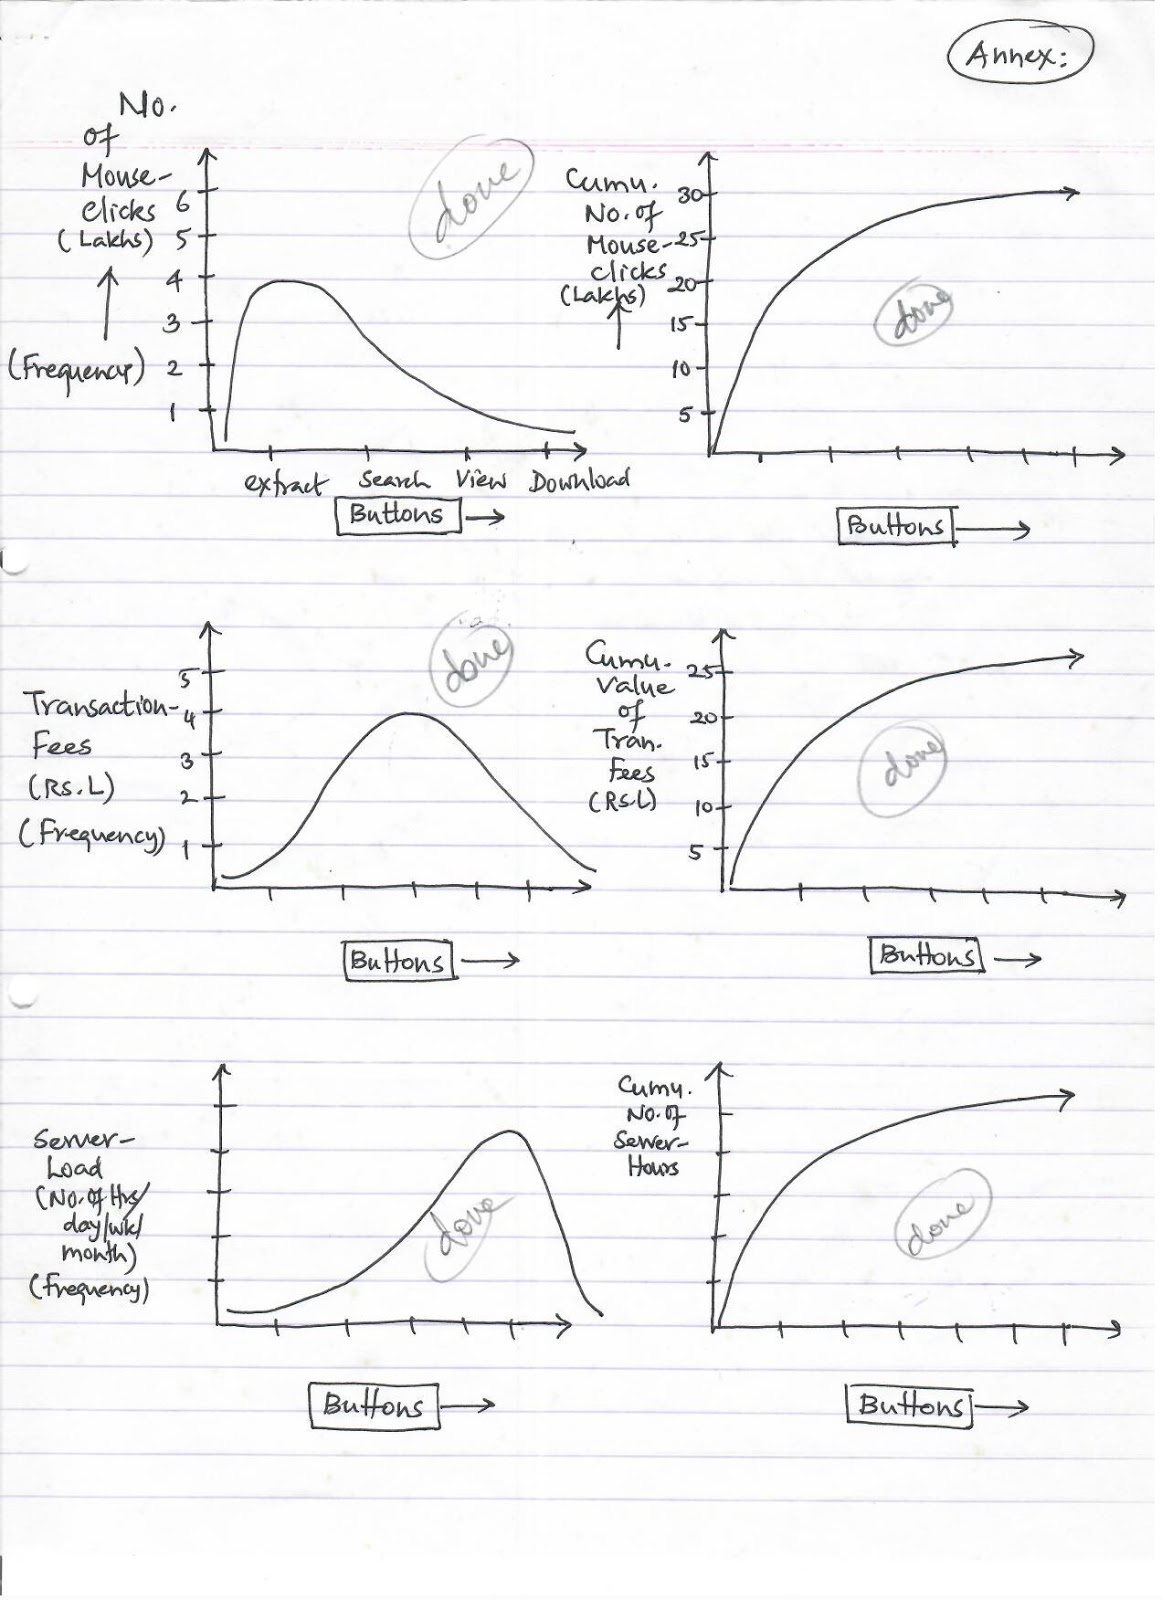
And
for extracting maximum money out of each client, Sanjeev will, every month,
closely examine the Customer-wise Usage & Revenue + Server-load
graphs shown in Annex.
This
study will tell him:
- What
are customer-wise usage patterns.
- In
which mouse-click we are losing out.
- In
which mouse-click we are achieving max. revenue (₹80/₹20 rule / A:B
analysis as shown in “U” graphs).
- Which
mouse-clicks are loading our server most.
The
actual “Cost of Conversion” is irrelevant to our pricing strategy —
which must remain geared to our “Lock-In” strategy.
Remember
that we have to make money overall from each customer. This would
require some buttons / some mouse-clicks getting subsidized by some
better-paying / better-yielding mouse-clicks!
So
what is far more important is to decide/figure out — and then enforce — ARPU
(Average Revenue Per User per month of course!)
Customer
Base = 432 (as on 20/09/03)
(Graph
1: Frequency Distribution)
X-axis:
Monthly ARPU (₹)
Y-axis:
Frequency (No. of Customers)
Two
curves shown:
- Bad
Model: High frequency at low ARPU (steep early
peak, quick fall).
- Good
Model: Broader distribution peaking toward
higher ARPU (flatter curve).
(Graph
2: Cumulative Curve)
X-axis:
Cumulative No. of Customers
Y-axis:
Cumulative Monthly Revenue (₹ Lakh)
Shows
a rising curve flattening toward saturation — illustrating diminishing returns
after top-paying customers.
At
a glance, such a monthly graph would tell Sanjeev:
→
Which (few) customers are Most Valuable and deserve max. personal
attention (the CAKE!).
→
Which (large no.) customers are Good Value and deserve regular email
communication to encourage them to stay on / increase their usage (the
BREAD!).
→
Which (few) customers are Value-less and deserve to be politely got rid
of (the CRUMBS!).
Web
— and more so, a Webservice — enables us to carry out real fine-tuning
of pricing, dynamically over time, in respect of each customer, so that
someday, our ARPU graph looks like this:
(Graph
illustration — ARPU Rs/Month vs. No. of Clients)
A
bell-shaped curve with high, stable middle, representing balanced revenue
spread.
Possible
— if we are clever!
(Signed
and dated: 16/09/03)