This is further to my earlier notes/emails on the subject, resting with my last note dt. 24th Aug. 2012.
Pl. let me know, what data (about each applied job) that you plan to capture. I suppose, this could well be, ALL the fields of the job applied—
Even though, at this moment, we may not know, how exactly we are going to use every captured “field”, for recommending more relevant jobs.
But it is better to capture everything. You never know, how it could help in future.
Page 2/2
This is just my preliminary concept and I invite you to suggest changes.
During my study, I found that “Design Positions/Titles” vary widely with small changes. There is no STANDARDIZATION / NORMALIZATION. Hence, computing their “Frequency of Occurrence” and tabulating in descending order, is impossible.
Once you have had an opportunity to study enclosed pages, pl. let me know. We may need to sit together, in order to finalize this matter, BEFORE you start capturing data on 10 Sept.
| Full Advt | In Widget |
|---|
-
Advt ID | | ✓
-
Designation (Position/Title) | | ✓
-
Company Name | | ✓
-
Job Description
-
Desired Profile
-
Compensation
-
Experience (No. of years) | | ✓
-
Industry Type
-
Education | | ✓
-
Location (City) | | ✓
-
Keywords
-
Post Date
-
Expiry Date
Typical “Brief Resume” for an “Experienced Buff” contains following fields
A. Personal Details
-
Name
-
D.O.B.
-
Gender
-
Marital Status
-
Email ID
-
Mobile No.
-
Country
-
City
B. Professional Details
-
Type – ○ IT ○ Non-IT
-
Primary Function
-
Exp. (yrs)
-
Designation Level
-
Current Industry
C. Text Resume
Shuklendu
24-08-12
Jobs Applied History → Job Recommendation System
What might database of "Jobs Applied History" of a candidate, might look like?
PEN: ___________
Name: ___________
| Sr. No | Date Appl. | Time Applied | Online | Offline (Widget) | Job ID | Field Details of Job Advt |
|---|---|---|---|---|---|---|
| Advt ID |
Field No: 11 is "Keywords".
-
A second table will keep “adding” these keywords and
-
Calculate their Frequency of Occurrence and
-
Arrange these keywords in Descending Order of the Frequency of Occurrence and
-
Calculate the Weightages of each keyword (taking top 100 keywords = 100)
As far as "Recommended / Matched Jobs" is concerned, current system of “matching” will continue, till a given candidate has applied against 100 job advts. (– assuming that, by that time, second table has a fairly respectable no. of "Keywords").
Would you like me to extract all 7 pages of this "Jobs Applied History → Job Recommendation System" series into one continuous Word document for you?
How can we leverage “Job Applied History” of each candidate?
-
In how many different “ways”, can we analyze this history?
-
What can such “analysis” tell us? Tell concerned jobseeker? Tell Corp. employers?
-
Will/can such “analysis” answer following questions?
-
How often does each user “log-in” thru widget?
(frequency/day/month/year – Ave/Max) -
How many job-alerts does he view/pull each time?
-
How many jobs does he “apply” each time?
-
Ratio = 3 / 2 =
{ All of these data must be compiled,
datewise/monthwise/yearwise
– for the day or the month or the year
– Cumulative. }
Page 4/7
-
At what “time-of-the-day” does each jobseeker log-in?
Is there a pattern?
Does each have a “favorite” time? -
During the course of the day, what % of widget-users log-in, at diff. times?
(Load on server) -
✅ Does each candidate have some favorite
-
Companies
-
Cities
to whom he frequently “applies”?
-
On monthly/annual basis, compile, in descending order (of frequencies of “Apply”):
-
Companies to which he applied
-
Cities to which he applied
This analysis will reveal what are his favorite Companies / Cities.
Knowing his “favorites” will help us recommend to him, future jobs advertised by
-
same companies
-
in same cities.
(Database of Intentions?)
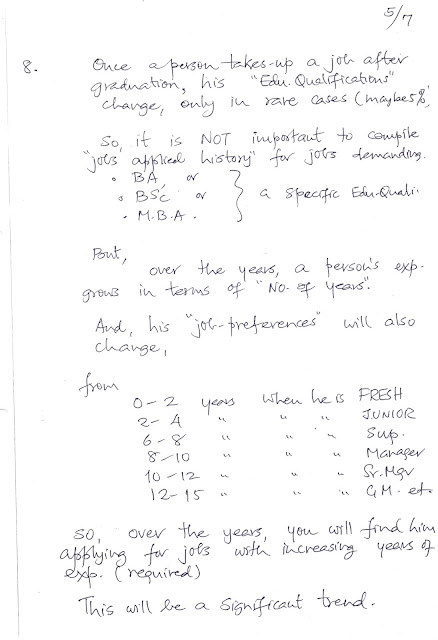
Once a person takes up a job after graduation, his "Edu. Qualification" changes only in rare cases (maybe 5%).
So, it is NOT important to compile “jobs applied history” for jobs demanding:
-
B.A. or
-
B.Sc. or
-
M.B.A.
→ a specific Edu. Quali.
But, over the years, a person's experience grows in terms of “No. of years”.
And his job preferences will also change,
from
0–2 years → when he is FRESH
2–4 " → " " " JUNIOR
6–8 " → " " " Sup.
8–10 " → " " " Manager
10–12 " → " " " Sr. Mgr
12–15 " → " " " G.M. etc.
So, over the years, you will find him applying for jobs with increasing years of exp. (required)
This will be a significant trend.
Now correlate this with his "age" (derived from his birthdate and adding one year to his age, on each birthday)
(Graph illustration)
Y-axis: "Jobs demanding Total Exp. (yrs)"
X-axis: "Age"
Range:
-
X-axis: 20 to 45
-
Y-axis: 2 to 14 (years of experience)
A diagonal trend line shows an increase in experience demand with age.
From "History of Jobs Applied", we can compile such “correlation tabulation” (if not a graph), for:
-
each candidate
-
all the candidates
That would tell us a lot about
“What” kind (how many years of demanded exp.)
of jobs, should we recommend to
“What” kind of candidates (how old candidates)
So, in final, we must analyse,
“Jobs Applied History”
for [ Individuals + All candidates put together ]
A. ✔ No. of Jobs Applied
B. ✔ Companies
C. ✔ Cities
D. ✘ Designations
E. ✘ Exp. (Demanded)
F. ✔ Keywords
Display?
⬜ Year ▼ ⬜ Mon ▼ ⬜ Date ▼
Let us discuss this after you study it.
👇
27–08–12


No comments:
Post a Comment