
Graph 1 (Top)
- Age Group: 11 AND 14
- Population: 790
- Data Points (Salary (Rs./Year) - No. of
candidates):
- (10K-0K): 120
- (0K-10K): 246
- (10K-20K): 207
- (20K-30K): 127
- (30K-40K): 56
- (40K-50K): 26
- (50K-60K): 14
- (60K-70K): 7
- (70K-80K): 2
- (80K-90K): 2
- (90K-100K): 1
Graph 2 (Bottom)
- Age Group: 15 AND 26
- Population: 1227
- Data Points (Salary (Rs./Year) - No. of
candidates):
- (10K-0K): 302
- (0K-10K): 588
- (10K-20K): 179
- (20K-30K): 60
- (30K-40K): 23
- (40K-50K): 6
- (50K-60K): 2
- (60K-70K): 2
- (70K-80K): 1
- (80K-90K): 3
- (90K-100K): 1
Graph 1 (Top)
- Age Group: 11 AND 35
- Population: 1283
- Data Points (Salary (Rs./Year) - No. of
candidates):
- (10K-0K): 260
- (0K-10K): 648
- (10K-20K): 292
- (20K-30K): 114
- (30K-40K): 47
- (40K-50K): 17
- (50K-60K): 6
- (60K-70K): 11
- (70K-80K): 4
- (80K-90K): 2
- (90K-100K): 2
Graph 2 (Bottom)
- Age Group: 19 AND 30
- Population: 977
- Data Points (Salary (Rs./Year) - No. of
candidates):
- (10K-0K): 152
- (0K-10K): 394
- (10K-20K): 243
- (20K-30K): 86
- (30K-40K): 38
- (40K-50K): 32
- (50K-60K): 10
- (60K-70K): 13
- (70K-80K): 2
- (80K-90K): 2
- (90K-100K): 2
Graph 1 (Top)
- Age Group: 11 AND 32
- Population: 689
- Data Points (Salary (Rs./Year) - No. of
candidates):
- (10K-0K): 120
- (0K-10K): 236
- (10K-20K): 146
- (20K-30K): 88
- (30K-40K): 52
- (40K-50K): 27
- (50K-60K): 13
- (60K-70K): 10
- (70K-80K): 9
- (80K-90K): 6
- (90K-100K): 2
Graph 2 (Bottom)
- Age Group: 31 AND 34
- Population: 564
- Data Points (Salary (Rs./Year) - No. of
candidates):
- (10K-0K): 35
- (0K-10K): 188
- (10K-20K): 140
- (20K-30K): 61
- (30K-40K): 42
- (40K-50K): 31
- (50K-60K): 13
- (60K-70K): 10
- (70K-80K): 12
- (80K-90K): 6
- (90K-100K): 6
Graph 1 (Top)
- Age Group: 11 AND 36
- Population: 452
- Data Points (Salary (Rs./Year) - No. of
candidates):
- (10K-0K): 45
- (0K-10K): 119
- (10K-20K): 103
- (20K-30K): 53
- (30K-40K): 42
- (40K-50K): 29
- (50K-60K): 21
- (60K-70K): 16
- (70K-80K): 6
- (80K-90K): 9
- (90K-100K): 6
Graph 2 (Bottom)
- Age Group: 37 AND 38
- Population: 199
- Data Points (Salary (Rs./Year) - No. of
candidates):
- (10K-0K): 52
- (0K-10K): 103
- (10K-20K): 67
- (20K-30K): 22
- (30K-40K): 14
- (40K-50K): 7
- (50K-60K): 2
- (60K-70K): 3
- (70K-80K): 9
- (80K-90K): 1
- (90K-100K): 1
Graph 1 (Top)
- Age Group: 11 AND 40
- Population: 265
- Data Points (Salary (Rs./Year) - No. of
candidates):
- (10K-0K): 55
- (0K-10K): 70
- (10K-20K): 40
- (20K-30K): 20
- (30K-40K): 12
- (40K-50K): 2
- (50K-60K): 2
- (60K-70K): 2
- (70K-80K): 2
- (80K-90K): 2
- (90K-100K): 2
Graph 2 (Bottom)
- Age Group: 41 AND 42
- Population: 174
- Data Points (Salary (Rs./Year) - No. of
candidates):
- (10K-0K): 27
- (0K-10K): 41
- (10K-20K): 27
- (20K-30K): 17
- (30K-40K): 20
- (40K-50K): 4
- (50K-60K): 9
- (60K-70K): 5
- (70K-80K): 4
- (80K-90K): 4
- (90K-100K): 4
Graph 1 (Top)
- Age Group: 11 AND 44
- Population: 128
- Data Points (Salary (Rs./Year) - No. of
candidates):
- (10K-0K): 8
- (0K-10K): 12
- (10K-20K): 31
- (20K-30K): 14
- (30K-40K): 15
- (40K-50K): 9
- (50K-60K): 6
- (60K-70K): 19
- (70K-80K): 8
- (80K-90K): 3
- (90K-100K): 3
Graph 2 (Bottom)
- Age Group: 45 AND 46
- Population: 117
- Data Points (Salary (Rs./Year) - No. of
candidates):
- (10K-0K): 5
- (0K-10K): 24
- (10K-20K): 18
- (20K-30K): 16
- (30K-40K): 14
- (40K-50K): 8
- (50K-60K): 5
- (60K-70K): 7
- (70K-80K): 6
- (80K-90K): 5
- (90K-100K): 5
Graph 1 (Top)
- Age Group: 11 AND 48
- Population: 85
- Data Points (Salary (Rs./Year) - No. of
candidates):
- (10K-0K): 11
- (0K-10K): 24
- (10K-20K): 10
- (20K-30K): 6
- (30K-40K): 15
- (40K-50K): 3
- (50K-60K): 4
- (60K-70K): 7
- (70K-80K): 5
- (80K-90K): 0
- (90K-100K): 0
Graph 2 (Bottom)
- Age Group: 49 AND 50
- Population: 64
- Data Points (Salary (Rs./Year) - No. of
candidates):
- (10K-0K): 10
- (0K-10K): 22
- (10K-20K): 17
- (20K-30K): 17
- (30K-40K): 17
- (40K-50K): 17
- (50K-60K): 3
- (60K-70K): 3
- (70K-80K): 3
- (80K-90K): 3
- (90K-100K): 3
Graph 1 (Top)
- Age Group: 11 AND 52
- Population: 44
- Data Points (Salary (Rs./Year) - No. of
candidates):
- (10K-0K): 13
- (0K-10K): 15
- (10K-20K): 11
- (20K-30K): 4
- (30K-40K): 1
- (40K-50K): 0
- (50K-60K): 0
- (60K-70K): 0
- (70K-80K): 0
- (80K-90K): 0
- (90K-100K): 0
Graph 2 (Bottom)
- Age Group: 53 AND 54
- Population: 39
- Data Points (Salary (Rs./Year) - No. of
candidates):
- (10K-0K): 5
- (0K-10K): 13
- (10K-20K): 8
- (20K-30K): 5
- (30K-40K): 2
- (40K-50K): 2
- (50K-60K): 2
- (60K-70K): 2
- (70K-80K): 0
- (80K-90K): 0
- (90K-100K): 0
Graph 1 (Top)
- Age Group: 11 AND 56
- Population: 32
- Data Points (Salary (Rs./Year) - No. of
candidates):
- (10K-0K): 4
- (0K-10K): 9
- (10K-20K): 7
- (20K-30K): 6
- (30K-40K): 3
- (40K-50K): 3
- (50K-60K): 0
- (60K-70K): 0
- (70K-80K): 0
- (80K-90K): 0
- (90K-100K): 0
Graph 2 (Bottom)
- Age Group: 57 AND 58
- Population: 21
- Data Points (Salary (Rs./Year) - No. of
candidates):
- (10K-0K): 1
- (0K-10K): 1
- (10K-20K): 1
- (20K-30K): 0
- (30K-40K): 3
- (40K-50K): 1
- (50K-60K): 1
- (60K-70K): 2
- (70K-80K): 0
- (80K-90K): 0
- (90K-100K): 0
Graph 1 (Top)
- Age Group: 59 AND 60
- Population: 12
- Data Points (Salary (Rs./Year) - No. of
candidates):
- (10K-0K): 2
- (0K-10K): 1
- (10K-20K): 1
- (20K-30K): 0
- (30K-40K): 1
- (40K-50K): 4
- (50K-60K): 1
- (60K-70K): 0
- (70K-80K): 0
- (80K-90K): 0
- (90K-100K): 0
Handwritten Note:
"This set of graphs follow the exact pattern as 'Age' graphs, because of
the simple equation/formula adopted by us in Computing "Total Exp".
Hence entire credibility is lost! Age-wise graphs & Exp.-wise graphs appear
absolutely identical with same "No:" on Y-axis! We must find a
way!"
Top Graph (Scan_0011 - Upper):
- Graph Title/Legend: FREQUENCY DISTRIBUTION
GRAPH, SALARY - WISE, Experience between 1 AND 2
- Population: '799'
- X-axis (Salary in thousands (Rs./Years)) vs.
Y-axis (No. of candidates):
- (10K): 112
- (10K-20K): 245
- (20K-30K): 207
- (30K-40K): 127
- (40K-50K): 58
- (50K-60K): 26
- (60K-70K): 14
- (70K-80K): 7
- (80K-90K): 5
- (90K-100K): 2
Bottom Graph (Scan_0011 -
Lower):
- Graph Title/Legend: FREQUENCY DISTRIBUTION
GRAPH, SALARY - WISE, Experience between 1 AND 4
- Population: '1122'
- X-axis (Salary in thousands (Rs./Years)) vs.
Y-axis (No. of candidates):
- (10K): 362
- (10K-20K): 568
- (20K-30K): 178
- (30K-40K): 60
- (40K-50K): 23
- (50K-60K): 8
- (60K-70K): 6
- (70K-80K): 2
- (80K-90K): 1
- (90K-100K): 3
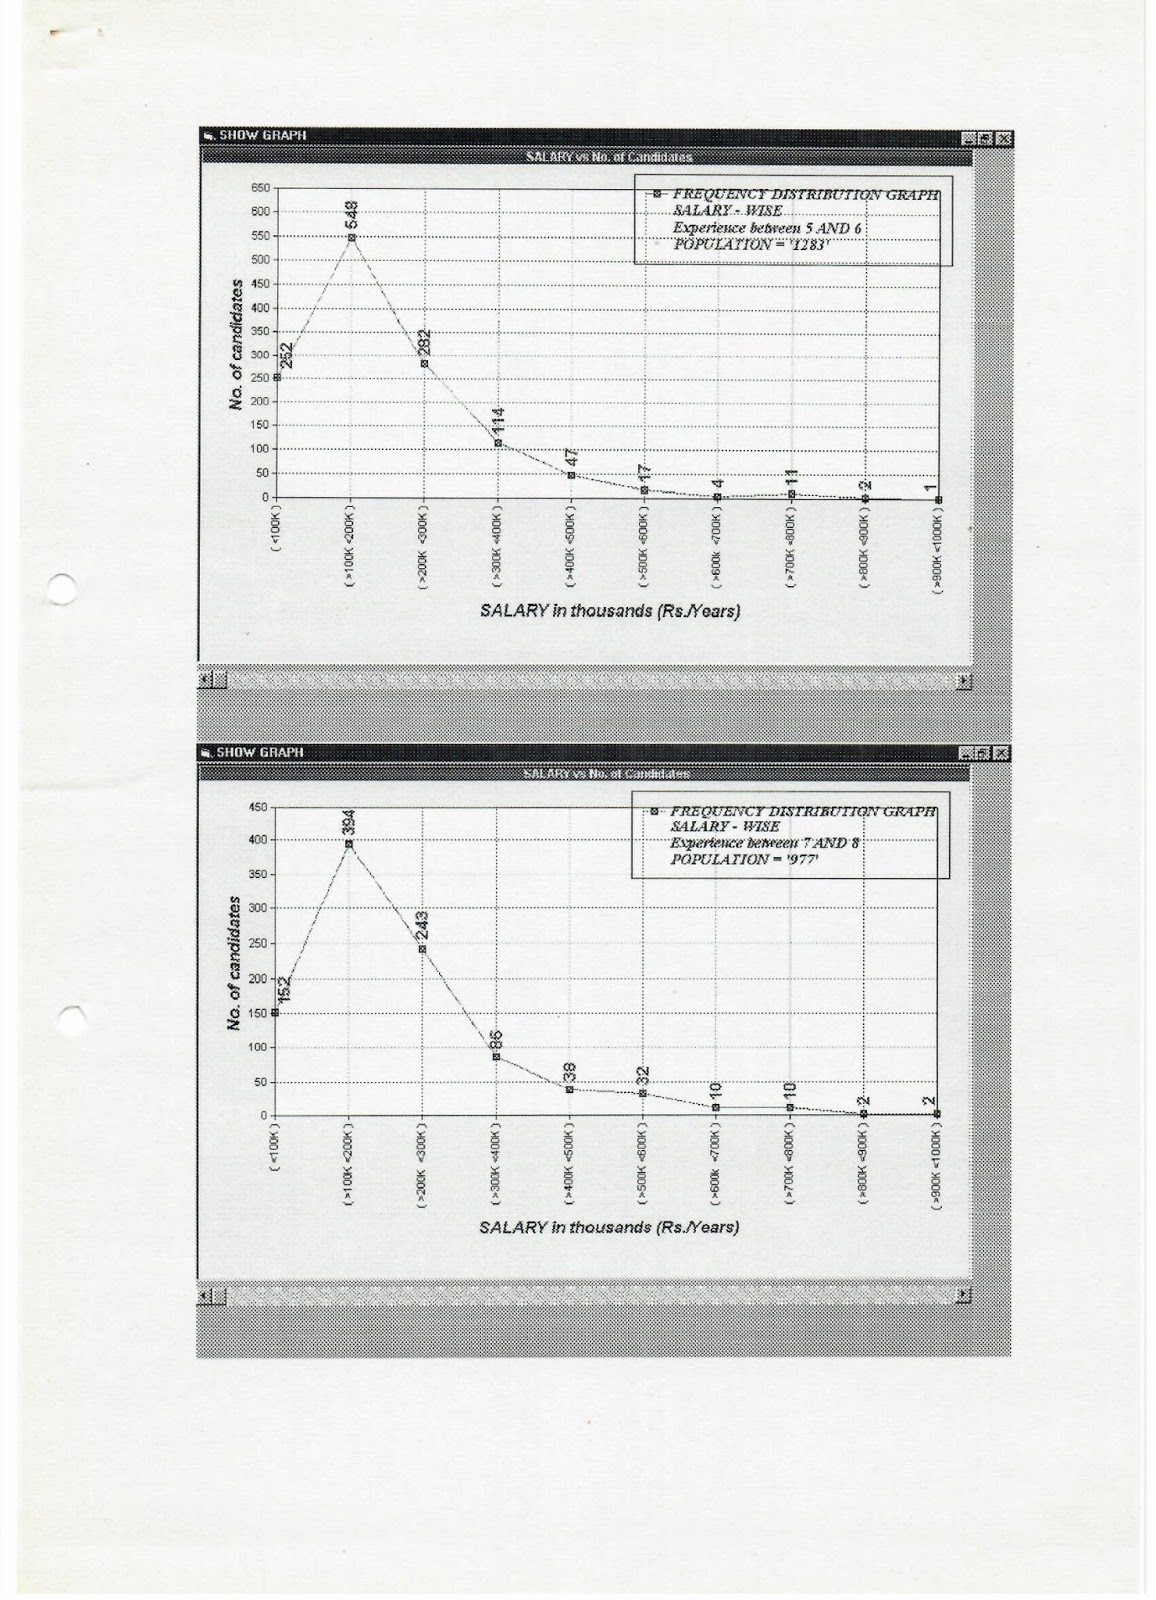
Top Graph (Scan_0012 - Upper):
- Graph Title/Legend: FREQUENCY DISTRIBUTION
GRAPH, SALARY - WISE, Experience between 5 AND 6
- Population: '1283'
- X-axis (Salary in thousands (Rs./Years)) vs.
Y-axis (No. of candidates):
- (10K): 352
- (10K-20K): 548
- (20K-30K): 292
- (30K-40K): 114
- (40K-50K): 47
- (50K-60K): 17
- (60K-70K): 4
- (70K-80K): 11
- (80K-90K): 2
- (90K-100K): 2
Bottom Graph (Scan_0012 -
Lower):
- Graph Title/Legend: FREQUENCY DISTRIBUTION
GRAPH, SALARY - WISE, Experience between 7 AND 8
- Population: '777'
- X-axis (Salary in thousands (Rs./Years)) vs.
Y-axis (No. of candidates):
- (10K): 152
- (10K-20K): 354
- (20K-30K): 243
- (30K-40K): 89
- (40K-50K): 38
- (50K-60K): 22
- (60K-70K): 10
- (70K-80K): 10
- (80K-90K): 7
- (90K-100K): 2
Top Graph (Scan_0013 - Upper):
- Graph Title/Legend: FREQUENCY DISTRIBUTION
GRAPH, SALARY - WISE, Experience between 9 AND 10
- Population: '589'
- X-axis (Salary in thousands (Rs./Years)) vs.
Y-axis (No. of candidates):
- (10K): 96
- (10K-20K): 238
- (20K-30K): 148
- (30K-40K): 99
- (40K-50K): 52
- (50K-60K): 27
- (60K-70K): 13
- (70K-80K): 10
- (80K-90K): 9
- (90K-100K): 6
Bottom Graph (Scan_0013 -
Lower):
- Graph Title/Legend: FREQUENCY DISTRIBUTION
GRAPH, SALARY - WISE, Experience between 11 AND 12
- Population: '444'
- X-axis (Salary in thousands (Rs./Years)) vs.
Y-axis (No. of candidates):
- (10K): 55
- (10K-20K): 183
- (20K-30K): 140
- (30K-40K): 51
- (40K-50K): 48
- (50K-60K): 31
- (60K-70K): 13
- (70K-80K): 10
- (80K-90K): 12
- (90K-100K): 8
Top Graph (Scan_0014 - Upper):
- Graph Title/Legend: FREQUENCY DISTRIBUTION
GRAPH, SALARY - WISE, Experience between 13 AND 14
- Population: '432'
- X-axis (Salary in thousands (Rs./Years)) vs.
Y-axis (No. of candidates):
- (10K): 65
- (10K-20K): 119
- (20K-30K): 103
- (30K-40K): 82
- (40K-50K): 42
- (50K-60K): 21
- (60K-70K): 21
- (70K-80K): 16
- (80K-90K): 18
- (90K-100K): 5
Bottom Graph (Scan_0014 -
Lower):
- Graph Title/Legend: FREQUENCY DISTRIBUTION
GRAPH, SALARY - WISE, Experience between 15 AND 16
- Population: '346'
- X-axis (Salary in thousands (Rs./Years)) vs.
Y-axis (No. of candidates):
- (10K): 69
- (10K-20K): 103
- (20K-30K): 57
- (30K-40K): 22
- (40K-50K): 4
- (50K-60K): 7
- (60K-70K): 7
- (70K-80K): 9
- (80K-90K): 9
- (90K-100K): 1
Top Graph (Scan_0015 - Upper):
- Graph Title/Legend: FREQUENCY DISTRIBUTION
GRAPH, SALARY - WISE, Experience between 17 AND 18
- Population: '265'
- X-axis (Salary in thousands (Rs./Years)) vs.
Y-axis (No. of candidates):
- (10K): 61
- (10K-20K): 75
- (20K-30K): 40
- (30K-40K): 28
- (40K-50K): 18
- (50K-60K): 12
- (60K-70K): 9
- (70K-80K): 1
- (80K-90K): 0
- (90K-100K): 2
Bottom Graph (Scan_0015 -
Lower):
- Graph Title/Legend: FREQUENCY DISTRIBUTION
GRAPH, SALARY - WISE, Experience between 19 AND 20
- Population: '171'
- X-axis (Salary in thousands (Rs./Years)) vs.
Y-axis (No. of candidates):
- (10K): 5
- (10K-20K): 27
- (20K-30K): 41
- (30K-40K): 27
- (40K-50K): 17
- (50K-60K): 20
- (60K-70K): 6
- (70K-80K): 9
- (80K-90K): 8
- (90K-100K): 4
Top Graph (Scan_0016 - Upper):
- Graph Title/Legend: FREQUENCY DISTRIBUTION
GRAPH, SALARY - WISE, Experience between 21 AND 22
- Population: '126'
- X-axis (Salary in thousands (Rs./Years)) vs.
Y-axis (No. of candidates):
- (10K): 0
- (10K-20K): 8
- (20K-30K): 31
- (30K-40K): 14
- (40K-50K): 15
- (50K-60K): 8
- (60K-70K): 6
- (70K-80K): 19
- (80K-90K): 4
- (90K-100K): 3
Bottom Graph (Scan_0016 -
Lower):
- Graph Title/Legend: FREQUENCY DISTRIBUTION
GRAPH, SALARY - WISE, Experience between 11 AND 24
- Population: '101'
- X-axis (Salary in thousands (Rs./Years)) vs.
Y-axis (No. of candidates):
- (10K): 0
- (10K-20K): 24
- (20K-30K): 20
- (30K-40K): 15
- (40K-50K): 14
- (50K-60K): 7
- (60K-70K): 5
- (70K-80K): 7
- (80K-90K): 4
- (90K-100K): 5
Top Graph (Scan_0017 - Upper):
- Graph Title/Legend: FREQUENCY DISTRIBUTION
GRAPH, SALARY - WISE, Experience between 25 AND 26
- Population: '95'
- X-axis (Salary in thousands (Rs./Years)) vs.
Y-axis (No. of candidates):
- (10K): 0
- (10K-20K): 11
- (20K-30K): 24
- (30K-40K): 10
- (40K-50K): 6
- (50K-60K): 13
- (60K-70K): 4
- (70K-80K): 3
- (80K-90K): 8
- (90K-100K): 4
Bottom Graph (Scan_0017 -
Lower):
- Graph Title/Legend: FREQUENCY DISTRIBUTION
GRAPH, SALARY - WISE, Experience between 25 AND 26
- Population: '93' (Note: '93' is manually
read from the graph point, the legend says '93')
- X-axis (Salary in thousands (Rs./Years)) vs.
Y-axis (No. of candidates):
- (10K): 10
- (10K-20K): 10
- (20K-30K): 22
- (30K-40K): 18 (Approximation between 18 and 20
based on line)
- (40K-50K): 17
- (50K-60K): 13 (Approximation between 12 and 14
based on line)
- (60K-70K): 9
- (70K-80K): 9
- (80K-90K): 9
- (90K-100K): 3
Top Graph (Scan_0018 - Upper):
- Graph Title/Legend: FREQUENCY DISTRIBUTION
GRAPH, SALARY - WISE, Experience between 29 AND 30
- Population: '44'
- X-axis (Salary in thousands (Rs./Years)) vs.
Y-axis (No. of candidates):
- (10K): 0
- (10K-20K): 14
- (20K-30K): 15
- (30K-40K): 13
- (40K-50K): 11
- (50K-60K): 1
- (60K-70K): 0
- (70K-80K): 0
- (80K-90K): 0
- (90K-100K): 2
Bottom Graph (Scan_0018 -
Lower):
- Graph Title/Legend: FREQUENCY DISTRIBUTION
GRAPH, SALARY - WISE, Experience between 31 AND 32
- Population: '38'
- X-axis (Salary in thousands (Rs./Years)) vs.
Y-axis (No. of candidates):
- (10K): 0
- (10K-20K): 1
- (20K-30K): 13
- (30K-40K): 8
- (40K-50K): 6
- (50K-60K): 3
- (60K-70K): 2
- (70K-80K): 2
- (80K-90K): 3
- (90K-100K): 2
Top Graph (Scan_0019 - Upper):
- Graph Title/Legend: FREQUENCY DISTRIBUTION
GRAPH, SALARY - WISE, Experience between 33 AND 34
- Population: '32'
- X-axis (Salary in thousands (Rs./Years)) vs.
Y-axis (No. of candidates):
- (10K): 4
- (10K-20K): 7
- (20K-30K): 9
- (30K-40K): 7
- (40K-50K): 6
- (50K-60K): 4
- (60K-70K): 3
- (70K-80K): 3 (Approximation)
- (80K-90K): 3
- (90K-100K): 3
Bottom Graph (Scan_0019 -
Lower):
- Graph Title/Legend: FREQUENCY DISTRIBUTION
GRAPH, SALARY - WISE, Experience between 35 AND 36
- Population: '14'
- X-axis (Salary in thousands (Rs./Years)) vs.
Y-axis (No. of candidates):
- (10K): 1
- (10K-20K): 1
- (20K-30K): 1
- (30K-40K): 0
- (40K-50K): 3
- (50K-60K): 3
- (60K-70K): 1
- (70K-80K): 1
- (80K-90K): 2
- (90K-100K): 2
Top Graph (Scan_0020 - Upper):
- Graph Title/Legend: FREQUENCY DISTRIBUTION
GRAPH, SALARY - WISE, Experience between 37 AND 38
- Population: '12'
- X-axis (Salary in thousands (Rs./Years)) vs.
Y-axis (No. of candidates):
- (10K): 2
- (10K-20K): 1
- (20K-30K): 1
- (30K-40K): 0
- (40K-50K): 0
- (50K-60K): 1
- (60K-70K): 0
- (70K-80K): 4
- (80K-90K): 1
- (90K-100K): 1
Bottom Graph (Scan_0020 -
Lower):
- Graph Title/Legend: FREQUENCY DISTRIBUTION
GRAPH, SALARY - WISE, Experience between 39 AND 42
- Population: '10'
- X-axis (Salary in thousands (Rs./Years)) vs.
Y-axis (No. of candidates):
- (10K): 0
- (10K-20K): 0
- (20K-30K): 2
- (30K-40K): 1
- (40K-50K): 0
- (50K-60K): 0
- (60K-70K): 0
- (70K-80K): 0
- (80K-90K): 0
- (90K-100K): 0
- Top Graph:
- Title: SHOW GRAPH | SALARY vs No. of Candidates
- Legend: FREQUENCY DISTRIBUTION GRAPH | SALARY -
WISE | DESIGNATION = 'Trainee' | POPULATION = '164'
- Y-axis: No. of candidates (0 to 35)
- X-axis: SALARY (Categories: 50k, ( 50k 100k), ( 100k 150k), ( 150k 200k), ( 200k 250k), 250k)
- Data Points: 15, 31, 22, 22, 9, 6 (The handwritten
categories below the x-axis are: 50k, ( 50k 100k), ( 100k 150k), ( 150 200), ( 200 250), 250)
- Bottom Graph:
- Title: SHOW GRAPH | SALARY vs No. of Candidates
- Legend: FREQUENCY DISTRIBUTION GRAPH | SALARY -
WISE | DESIGNATION = 'Executive Officer' | POPULATION = '1105'
- Y-axis: No. of candidates (0 to 400)
- X-axis: SALARY (Categories: 5000k, 10000k, 15000k,
20000k, 25000k, 30000k, 35000k, 40000k, 45000k, 50000k, 50000k)
- Data Points: 95, 305, 325, 160, 75, 55, 35, 30,
20, 10, 5
- Top Graph:
- Title: SHOW GRAPH | SALARY vs No. of Candidates
- Legend: FREQUENCY DISTRIBUTION GRAPH | SALARY -
WISE | Age between 21 AND 24 | POPULATION = '799'
- Y-axis: No. of candidates (0 to 280)
- X-axis: SALARY in thousands (Rs./Years)
(Categories: 5000k, 10000k, 15000k, 20000k, 25000k, 30000k, 35000k,
40000k, 45000k, 50000k, 50000k)
- Data Points: 95, 265, 205, 125, 50, 35, 12, 5, 2,
1, 0
- Bottom Graph:
- Title: SHOW GRAPH | SALARY vs No. of Candidates
- Legend: FREQUENCY DISTRIBUTION GRAPH | SALARY -
WISE | Age between 25 AND 26 | POPULATION = '1117'
- Y-axis: No. of candidates (0 to 360)
- X-axis: SALARY in thousands (Rs./Years)
(Categories: 5000k, 10000k, 15000k, 20000k, 25000k, 30000k, 35000k,
40000k, 45000k, 50000k, 50000k)
- Data Points: 75, 301, 310, 251, 125, 55, 25, 22,
10, 5, 1
- Graph:
- Title: SHOW GRAPH | SALARY vs No. of Candidates
- Legend: FREQUENCY DISTRIBUTION GRAPH | SALARY -
WISE | DESIGNATION = 'Trainee' | POPULATION = '164'
- Y-axis: No. of candidates (0 to 35)
- X-axis: SALARY in thousands (Rs./Years)
(Categories: 5000k, 10000k, 15000k, 20000k, 25000k, 30000k, 35000k,
40000k, 45000k, 50000k, 50000k)
- Data Points: 19, 31, 22, 22, 3, 0, 0, 0, 0, 0, 0
- Top Graph:
- Title: SHOW GRAPH | SALARY vs No. of Candidates
- Legend: FREQUENCY DISTRIBUTION GRAPH | SALARY -
WISE | DESIGNATION = 'Executive Officer' | POPULATION = '164'
- Y-axis: No. of candidates (0 to 40)
- X-axis: SALARY in thousands (Rs./Years)
(Categories: ( 50k), ( 50k 100k),
( 100k 150k), ( 150k 200k), ( 200k 250k), ( 250k 500k))
- Data Points: 19, 35, 22, 22, 23, 5
- Handwritten note: ok, Table
- Bottom Graph:
- Title: SHOW GRAPH | SALARY vs No. of Candidates
- Legend: FREQUENCY DISTRIBUTION GRAPH | SALARY -
WISE | DESIGNATION = 'Executive Officer' | POPULATION = '1105'
- Y-axis: No. of candidates (0 to 550)
- X-axis: SALARY in thousands (Rs./Years)
(Categories: ( 100k), ( 100k 200k), ( 200k 300k), ( 300k 400k), ( 400k 500k), ( 500k 600k), ( 600k 700k), ( 700k 800k), ( 800k 900k), ( 900k 1000k), ( 1000k))
- Data Points: 450, 430, 114, 20, 5, 4, 10, 5, 1, 0,
3
- Handwritten note: ok, Table
- Top Graph:
- Title: SHOW GRAPH | SALARY vs No. of Candidates
- Legend: FREQUENCY DISTRIBUTION GRAPH | SALARY -
WISE | DESIGNATION = 'Senior Manager' | POPULATION = '4463'
- Y-axis: No. of candidates (0 to 2200)
- X-axis: SALARY in thousands (Rs./Years)
(Categories: ( 100k), ( 100k 200k), ( 200k 300k), ( 300k 400k), ( 400k 500k), ( 500k 600k), ( 600k 700k), ( 700k 800k), ( 800k 900k), ( 900k 1000k), ( 1000k))
- Data Points: 720, 1840, 1036, 430, 195, 87, 31,
27, 2, 2, 2
- Handwritten note: ok, Annual Salary (Rs.
000/year), Table
- Bottom Graph:
- Title: SHOW GRAPH | SALARY vs No. of Candidates
- Legend: FREQUENCY DISTRIBUTION GRAPH | SALARY -
WISE | DESIGNATION = 'General Manager' | POPULATION = '1197'
- Y-axis: No. of candidates (0 to 280)
- X-axis: SALARY in thousands (Rs./Years)
(Categories: ( 100k), ( 100k 200k), ( 200k 300k), ( 300k 400k), ( 400k 500k), ( 500k 600k), ( 600k 700k), ( 700k 800k), ( 800k 900k), ( 900k 1000k), ( 1000k))
- Data Points: 110, 153, 247, 195, 157, 150, 87, 85,
49, 101, 101
- Handwritten note: ok, Table
- Overall Handwritten Note: We are losing a
lot of valuable space in this arrangement! what can we do to reduce this
space & make it available for bigger Y Axis?
- Top Graph:
- Title: SHOW GRAPH | SALARY vs No. of Candidates
- Legend: FREQUENCY DISTRIBUTION GRAPH | SALARY -
WISE | DESIGNATION = 'Senior Manager' | POPULATION = '4463'
- Y-axis: No. of candidates (0 to 2200)
- X-axis: SALARY in thousands (Rs./Years)
(Categories: ( 100k), ( 100k 200k), ( 200k 300k), ( 300k 400k), ( 400k 500k), ( 500k 600k), ( 600k 700k), ( 700k 800k), ( 800k 900k), ( 900k 1000k), ( 1000k))
- Data Points: 720, 1840, 1036, 430, 195, 87, 31,
27, 2, 2, 2
- Handwritten Note: Duplicated! | President & MD
to be plotted.
- Bottom Graph:
- Title: SHOW GRAPH | SALARY vs No. of Candidates
- Legend: FREQUENCY DISTRIBUTION GRAPH | SALARY -
WISE | DESIGNATION = 'General Manager' | POPULATION = '1197'
- Y-axis: No. of candidates (0 to 280)
- X-axis: SALARY in thousands (Rs./Years)
(Categories: ( 100k), ( 100k 200k), ( 200k 300k), ( 300k 400k), ( 400k 500k), ( 500k 600k), ( 600k 700k), ( 700k 800k), ( 800k 900k), ( 900k 1000k), ( 1000k))
- Data Points: 97, 153, 247, 195, 157, 150, 87, 85,
49, 101, 101
- Top Graph (Age):
- Title: SHOW GRAPH | AGE vs No. of Candidates
- Legend: FREQUENCY DISTRIBUTION OF EXECUTIVES | AGE
- WISE | POPULATION = '7188'
- Y-axis: No. of candidates (0 to 800)
- X-axis: AGE (Years) (1 to 65)
- Selected Data Points (approx): 377, 473, 616, 719,
664, 511, 390, 309, 272, 252, 194, 150, 137, 102, 91, 75, 62, 53, 49, 42,
43, 39, 36, 35, 30, 26, 22, 18, 14, 10, 8, 4, 3, 2, 1, 0, 0
- Handwritten note: This is ok - except that when
launched on Recruitmy, we will not display the figures just above each
point. but a surfer can click on Table link to see the actual
values. | Table
- Bottom Graph (Experience):
- Title: SHOW GRAPH | EXPERIENCE vs No. of
Candidates
- Legend: FREQUENCY DISTRIBUTION OF EXECUTIVES |
EXPERIENCE - WISE | POPULATION = '7188'
- Y-axis: No. of candidates (0 to 800)
- X-axis: EXPERIENCE (Years) (1 to 65)
- Selected Data Points (approx): 377, 473, 616, 719,
664, 511, 390, 309, 272, 252, 194, 150, 137, 102, 91, 75, 62, 53, 49, 42,
43, 39, 36, 35, 30, 26, 22, 18, 14, 10, 8, 4, 3, 2, 1, 0, 0
- Handwritten Note: Because of our definition/
equation, the shape of "actual" Years of Exp is these hos.
coincide with "Age Profile". It looks "cooked up"
(Which it is!). With exactly SAME figs/nos. appearing on both graphs, we
are losing CREDIBILITY! So we must find another method of calculating
"Total Yrs of Exp" which is (and appears) more Credible.
- Graph:
- Title: SHOW GRAPH | DESIGNATION LEVEL vs No. of
Candidates
- Legend: FREQUENCY DISTRIBUTION OF EXECUTIVES |
DESIGNATION LEVEL-WISE | POPULATION = '7188'
- Y-axis: No. of candidates (0 to 5000)
- X-axis: DESIGNATION LEVEL (Categories: Trainee,
Executive Officer, Manager, General Manager, President/Executive
Director, Managing Director)
- Data Points: 164, 1105, 4463, 1297, 744, 125
Scan_0029.jpg: TENURE
FREQUENCY PROFILE
Graph Title: TENURE FREQUENCY
PROFILE (YEARS OF SERVICE IN A GIVEN JOB)
Sample Size: 250
Y-axis: NUMBERS (INCIDENCES)
X-axis: TENURE (YEARS)
Data Points (Tenure in Years,
Incidences):
- $1$ year: 40
- 1 year: 73
- 2 years: 43
- 3 years: 33
- 4 years: 21
- 5 years: 14
- 6 years: 3
- 7 years: 4
- 8 years: 5
- 9 years: 11
- 10 years: 3
- 11 years: 2
- 12 years: 4
- 13 years: 2
- 14 years: 3
- 15 years: 1
Job Tenure Data Table
Table Title: Job Tenure
(yrs) - Total
|
Page |
1 |
1 |
2 |
3 |
4 |
5 |
6 |
7 |
8 |
9 |
10 |
11 |
12 |
13 |
14 |
15 |
Total |
|
1 |
3 |
8 |
6 |
2 |
1 |
2 |
- |
1 |
- |
- |
- |
- |
- |
- |
- |
- |
26 |
|
2 |
8 |
10 |
6 |
3 |
1 |
- |
- |
1 |
- |
- |
- |
- |
- |
- |
- |
- |
30 |
|
3 |
3 |
4 |
2 |
3 |
3 |
1 |
1 |
- |
- |
- |
- |
- |
- |
- |
- |
- |
19 |
|
4 |
2 |
4 |
5 |
3 |
1 |
2 |
- |
- |
1 |
1 |
- |
- |
- |
- |
- |
- |
19 |
|
5 |
4 |
7 |
3 |
2 |
2 |
- |
1 |
- |
- |
- |
- |
- |
- |
- |
- |
- |
19 |
|
6 |
3 |
4 |
3 |
2 |
- |
2 |
- |
- |
- |
2 |
1 |
- |
- |
- |
- |
- |
17 |
|
7 |
1 |
6 |
7 |
5 |
3 |
- |
- |
- |
- |
1 |
- |
- |
- |
- |
- |
- |
23 |
|
8 |
7 |
7 |
2 |
4 |
3 |
- |
- |
- |
1 |
- |
- |
- |
- |
- |
1 |
- |
25 |
|
9 |
2 |
9 |
4 |
3 |
3 |
1 |
- |
- |
- |
1 |
- |
- |
- |
- |
- |
- |
23 |
|
10 |
4 |
7 |
4 |
3 |
3 |
3 |
1 |
- |
2 |
- |
- |
- |
- |
- |
1 |
- |
28 |
|
11 |
3 |
7 |
1 |
3 |
1 |
2 |
- |
- |
1 |
1 |
2 |
- |
- |
- |
- |
- |
21 |
|
Total |
40 |
73 |
43 |
33 |
21 |
14 |
3 |
3 |
5 |
11 |
5 |
2 |
- |
1 |
- |
1 |
250 |
SALARY FREQUENCY PROFILE
Graph Title: SALARY FREQUENCY
PROFILE (Salarywise Distribution of candidates in our database)
Sample Size: 158
Y-axis: NO. OF CANDIDATES
X-axis: ANNUAL SALARY (RS, 000)
Data Points (Salary Range (in
Rs. 000), No. of Candidates):
- 0-50: 18
- 51-100: 29
- 101-150: 23
- 151-200: 24
- 201-250: 12
- 251-300: 12
- 301-350: 8
- 351-400: 12
- 401-450: 1
- 451-500: 6
- 501-550: 1
- 551-600: 1
- 601-650: 3
- 651-700: 3
- 701-750: 1
- 751-800: 3
- 801-850: 2
- 851-900: 2
- 901-950: 1
- 951-1000: 1
AGE FREQUENCY PROFILE
Graph Title: AGE FREQUENCY
PROFILE (Age-wise Distribution of candidates)
Sample Size: 75
Y-axis: NUMBERS (FREQUENCY)
X-axis: AGE (YEARS)
Data Points (Age in Years,
Frequency):
- 23: 2
- 24: 6
- 25: 4
- 26: 4
- 27: 6
- 28: 2
- 29: 6
- 30: 4
- 31: 8
- 32: 1
- 33: 8
- 34: 2.5 (approx 2 or 3)
- 35: 2.5 (approx 2 or 3)
- 36: 2
- 37: 2
- 38: 2
- 39: 1
- 40: 1
- 41: 2
- 42: 1
- 43: 1
- 44: 2
- 45: 1
AGE VS. SALARY SCATTERGRAM
Graph Title: AGE VS. SALARY
SCATTERGRAM (2)
Sample Size: ---
Y-axis: SALARY (CRs. LAKHS)
X-axis: AGE
Notes:
- This Scattergram will be very similar to
"Years of Exp. Vs. Salary" Scattergram.
- With sufficiently large sample-size, "Line of
best fit" and "Age-wise" salary frequency distribution
graphs can be automatically plotted & displayed when clicked on a
given "Age".
Sketch/Example on Graph:
- A frequency distribution curve is drawn roughly
centered at Age 36, showing a typical distribution of salaries (from
approx. 7 lakhs to 20 lakhs) for that age.
YEARS OF EXPERIENCE VS. SALARY
SCATTERGRAM
Graph Title: YEARS OF EXPERIENCE
VS. SALARY SCATTERGRAM
Sample Size: 55
Y-axis: SALARY (CRs. Lakhs)
X-axis: YEARS OF EXPERIENCE
Notes:
- If we have a sample-size of, say, 10000 candidates:
- Statistical Software (WWW.Softglare(X.com), can
plot a "Line of best fit".
- For each "AGE", software can also plot a
"Frequency Distribution graphs" as show below. Maybe be an HR
Manager simply moves cursor over on any given "years of
Experience", a click, and corresponding graph will appear in a small
window. This would be a very powerful tool where we can charge Rs. 25 per
click!
Sketch/Example on Graph:
- A box is drawn around data points near 14 years of
experience, and a dashed frequency distribution curve is sketched to its
right, showing a concentration of salaries for that experience level.




No comments:
Post a Comment