
Kartavya
27-02-03
Leveraging RESUMINE while raising ENTRY-BARRIER
I refer to our telecon in the afternoon.
My proposal has 2 parts.
PART 1
Under this suggestion/proposal, a large (employment-wise) Organisation will collect/compile email resumes of all of its employees & then convert these, using Resumine.
Advantage
-
At one stroke, the Subscriber-Organisation would develop a structured, searchable database of all of its employees – whether the number is 50 or 50,000.
-
Over a period of time, that Organisation will eliminate hard-copy PERSONAL-FOLDERS of all of its employees (EMPLOYEE-RECORDS), as it moves more & more of its individual employee-related info online, in digitised form.
-
RESUMINE permits the Subscriber to take this FIRST step in that direction.
If a Subscriber employs
-
500 “Sales” personnel
-
200 “Mktg” personnel
-
2000 “Mfg” personnel, etc.
Then that organisation can plot frequency-distribution graphs (one for each “functional” area) by plotting the “scores” attained by each individual employee, belonging to that function.
(Hand-drawn bell curve showing Function: SALES, plotting Competence Score. Example: Venkat = 65%, Mr. Mhatre = 45%)
Such a graphical/easy-to-grasp representation would help HR manager as follows:
-
In which “areas” does Mr. Mhatre need further training to improve his “competence-score”?
-
Should we retain Mr. Mhatre (for retraining) or give him a “VRS” package? Golden Handshake.
-
How do we reward Venkat, who has improved from a score of 60% last year to 65% this year?
So, you can see how FREQUENCY-DISTRIBUTION of COMPETENCY-PROFILES (Function-Wise) provides vital inputs for:
-
Determining “Training Needs” & formulating “Training Programs” for employees in each functional area (an OD = Organisational Development activity).
-
Annual “Increments/Rewards”
-
“Right-sizing” the Organisation
(As per Jack Welch, every Company, every year, should “let-go” [read: sack] 10% of its lowest/poorest performers).
Of course, Competency-Profile should not be used in isolation/stand-alone for above-mentioned decisions. Goal-setting (at the start of the year) & actual performance measurement (at the end of the year) MUST be taken into account. In fact, those should have a greater weightage.
This is as far as “existing” employees are concerned.
Now, let us turn to a “new” candidate yet to be recruited, whose resume has just come in.
Part 2
We already have 75,000/80,000 email resumes lying with us.
During March, we expect to receive another 50,000 under Project Manhattan. This can be further stepped-up, if desired.
So, when we go online & launch our Resumine Research webservice, say, by June, we may already have 200,000 email resumes.
We should process all of these thru RESUMINE. When done, each resume will have a CORE “Functional” Competency (the topmost tier). So these 200,000 will get distributed amongst 53 “functional” areas.
Maybe, the highest “Function” may have 10,000 resumes & lowest may have 1000 resumes. These are still large enough populations to plot frequency-distribution curves.
(Hand-drawn bell curve: Function = SALES, Population = 8234)
There will be 53 such graphs like this – one for every “Function.”
And software should ensure that all incoming resumes are processed every day and the graphs must be updated accordingly.
This way, the “population” keeps growing & the graphs become more & more accurate/representative.
Now, suppose we have 200 subscribers who, between them, are “processing” 10,000 resumes everyday on our Webservice, then we have an unbeatable proposition!
A website like MonsterIndia already has 4.5 lakh resumes & this database is growing at 1000 per day!
Monster (USA) has 20 million resumes!
The larger the resume database, the more accurate the profile (distribution-curve).
As soon as a Recruiter “processes” an incoming resume thru our Resumine, the bars will appear.
Simultaneously, the “Frequency-Distribution Curve.”
Corresponding to the TOP-BAR FUNCTION, should also appear (– on our already crowded screen, we have to decide “where”).
Alternatively, only upon recruiter clicking the button [Compare with Population], the frequency-distribution graph may appear.
(Sketch: bar chart showing Sales = 63%, Mktg = 48%, Service = 29% → button “Compare with Population”)
New screen will appear as follows (replacing above screen).
(Sketch: bell curve showing Mr. Mhatre at 63% vs. Population = 8234. Caption: GLOBAL COMPETENCE BENCHMARK)
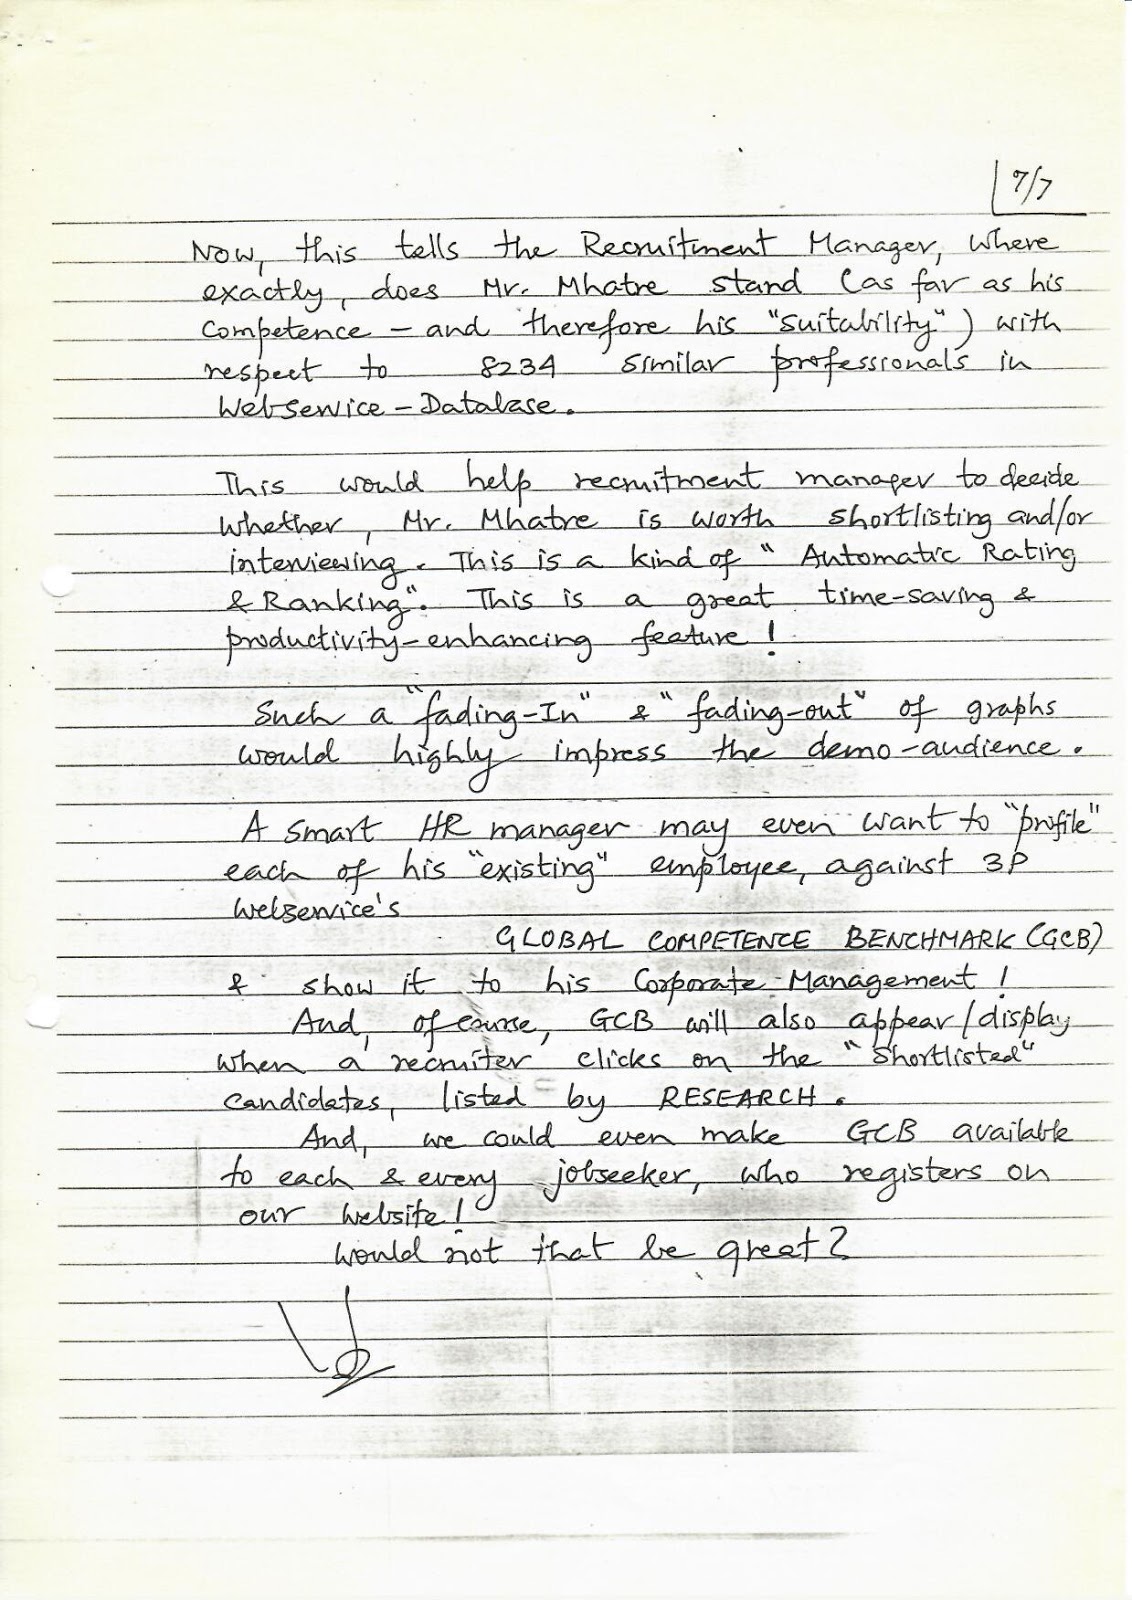
Now, this tells the Recruitment Manager where exactly does Mr. Mhatre stand (as far as his competence – and therefore his “suitability”) with respect to 8234 similar professionals in WebService-Database.
This would help recruitment manager to decide whether Mr. Mhatre is worth shortlisting and/or interviewing. This is a kind of “Automatic Rating & Ranking.” This is a great time-saving & productivity-enhancing feature!
Such a “fading-in” & “fading-out” of graphs would highly impress the demo-audience.
A smart HR manager may even want to “profile” each of his “existing” employees against 3P Webservice’s GLOBAL COMPETENCE BENCHMARK (GCB) & show it to his Corporate Management!
And, of course, GCB will also appear/display when a recruiter clicks on the “shortlisted” candidates listed by RESEARCH.
And, we could even make GCB available to each & every jobseeker, who registers on our website!
Would not that be great?


No comments:
Post a Comment